4.4 Insights Overview & Visualizations
Insights represent tools that are used to better understand data in FetchEH. Insights include Visualizations, Insight Filters and Insight Reports. This section will review defining an Area of Interest and Visualizations.
Key Concepts
Insights are applied to, and visualized on the map using Insights layers, which include System, Well and Surface Water Sample layers. This is important to understand because in order to gain insights about a mapped system component (Septic Tank, Drain Field, etc.) or event (O&M Event, Well Water Testing, etc.), those system components and events must be managed under a System, Well or Surface Water Sample on the map.
For example, you need to add system components and events to the System point (see Mapping/Data Collection for more) in order to access them in Insights tools. A mapped feature, such as a Septic Tank or Drain Field, that is not managed under a System point will not be included in any Insights tools.
For example, if a Query was executed to find all Systems where the Drain Field was installed prior to 1990, only those System points on the map that meet the Query Statement will be visualized. If a Drain Field is on the map, but is not managed under System point on the map, that Drain Field will not be included in the Insights Report and subsequent map visualization.
A system component or event is managed under a System point when it shares the 'System ID' of the System point.
If your workflows include adding system components to a System point on the map using a Form, then the system components will automatically be managed under that System point and automatically inherit the System points 'System ID'.
For system components that are not mapped, and all events, the only way to create them is to use the System, Well or Surface Water Sample and corresponding Form. In this instance, the unmapped system components and events will automatically inherit the 'System ID', and are managed under the System, Well or Surface Water Sample.
Exercise Menu
Use the menu below to jump to a specific task/workflow.
- Area of Interest:
Create a new Area of Interest for Insights and Save it.
- Visualizations:
Using Insights layers and their corresponding Fields to create Visualizations on the map.
Define and Save Area of Interest
The Area of Interest (Area) defines where Insights will be applied. Any System or Well within the boundary of an Area will be used for Insights tools, while Systems and Wells located outside the Area will be excluded from Insights.
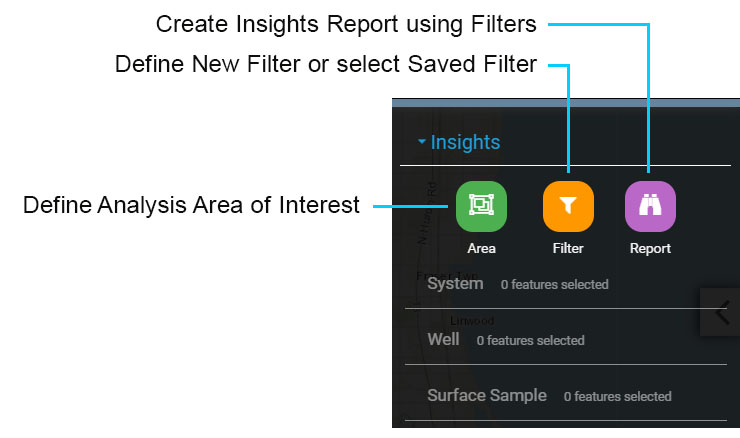
1.0 Open the Insights tools by selecting the Insights button on the Main Menu.

The Insights menu will open in the Side Pane with three initial options.
Area:is used to define an Area of Interest or select a Saved Area.
Filter:provides options for creating a new Filter, copying a Filter or modifying an existing Filter.
Report:provides options for creating a new Filter, copying a Filter or modifying an existing Filter.
1.1 Select the 'Area' button to define a new Area of Interest.
Insights Menu
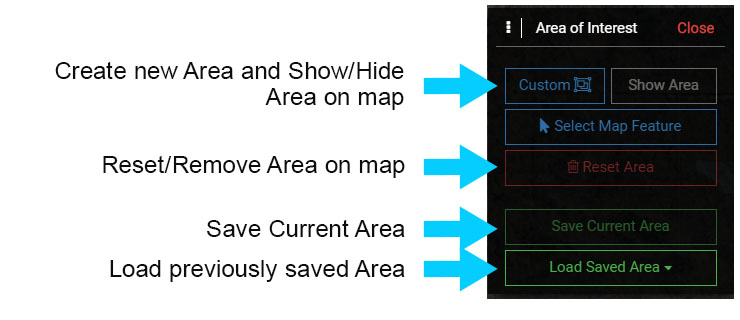
Selecting the 'Area' button will open a new floating menu with options to manage Area of Interests. These are described below:
Custom: Create a new Area by drawing the Area on the map. The Area will appear as a blue dashed line.
Show/Hide Area: Used to Show or Hide the Area on the map. Often the Area (blue dashed line) will be hidden for printing or PDFs.
Reset Area: Removes the Area (blue dashed line) from the map and clears any Insights Visualizations from the map.
Save Current Area: Saves the Area displayed on the map for future use.
Load Saved Area: Loads a previously Saved Area.
Area Menu
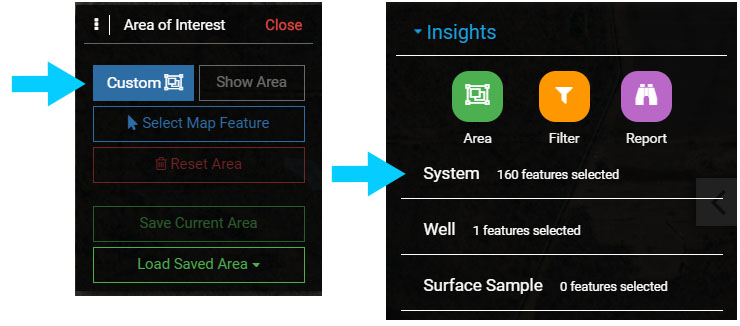
1.2 Select the 'Custom' button to create a new Area. On the map, draw a new Area and be sure that the Area includes System points that can be used for Insights.
Start the Area drawing by clicking on the map, then continue to define the Area. Double click to finish drawing the new Area.
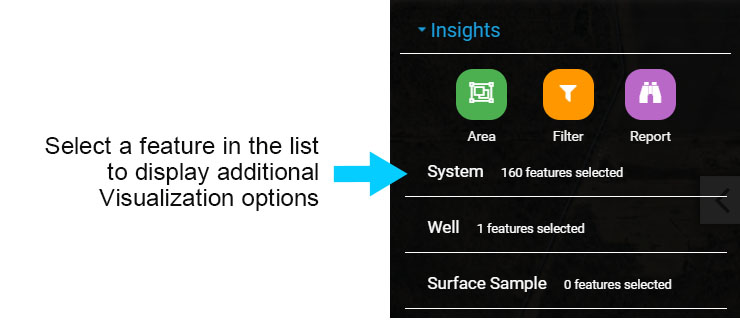
Once the new Area is complete, the Visualization menu will open and display the number of features that are within the boundary of the Area. In the image below there are 160 System features selected in the new Area.
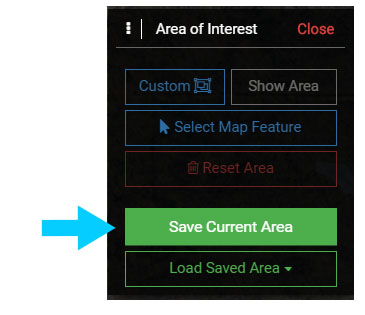
1.3 Before exploring the Visualization options, save the current Area by selecting 'Save Current Area'. Enter a name for the Area and save it. The Area will now be available in the 'Load Saved Area' menu.
Visualizations
Visualizations are used to display information about system components (Septic Tanks, Drain Fields, Wells etc.) and events (O&M, Well Water Testing, Surface Water Samples). The Visualization uses a field and its corresponding values to symbolize features on the map.
Insights use a management layer, like the System and Well layers, to create Visualizations and display them on the map. This includes creating Visualizations for system components and event (i.e. O&M events) data that are managed under a System point.
For example, a Visualization is created using the Capacity Gallons of Septic Tanks. The resulting Visualization will symbolize System points on the map according to the Capacity Gallons of any Septic Tank managed under a System point.
2.0 Visualization options are displayed after selecting an Insights layer. Select the 'System' to open the Visualization options.
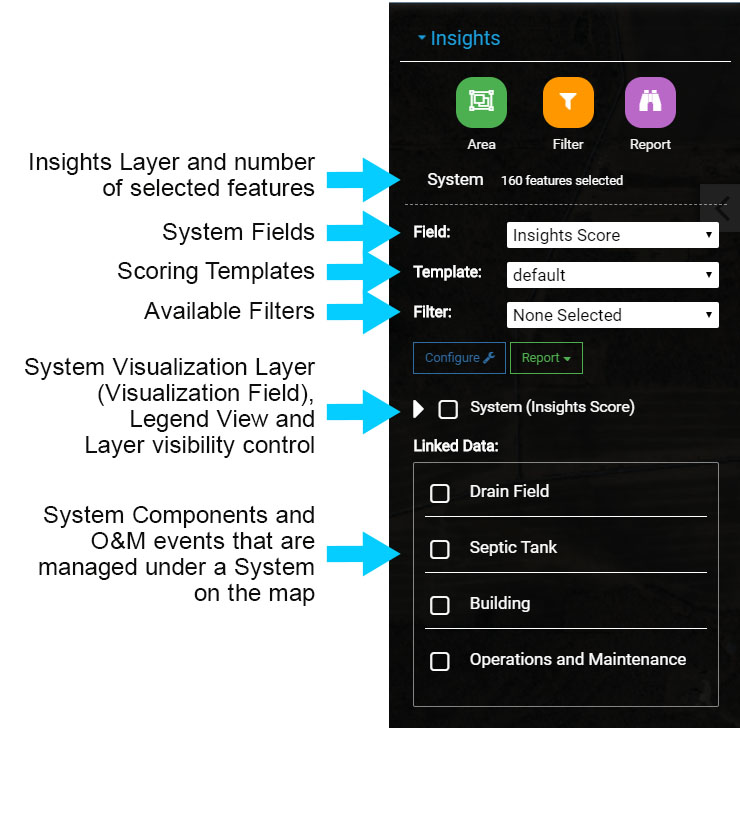
When an Insights layer is selected, such as the System, the following options are displayed along with a list of other system components and events managed under the Insights layer.
Insights Layer: Displays the name of the Insight layer (System) and the number of selected features in the Area. Select the text to expand/collapse the feature menu.
Field: Used to select a Field that is used to Visualize Systems on the map. Note that the Fields displayed in this menu only related to Insights layers, such as Systems.
Template: Used to select an existing Scoring Template that will be applied to a Visualization.
Filter: Used to select an existing Filter that will be applied to the Visualization.
Visualization Layer: Displays the Feature Layer (here System) and the current Field (Insights Score) used for a Visualization. Select the chevron to display the Legend, and toggle the visibility on/off using the check box control.
System Components/O&M events: Displays System Components and O&M Events managed under Systems as 'Linked Data'. Each component or O&M event in the list has a menu that is similar to the System menu.
When a component or O&M event is toggled on, the Field selected will be used to symbolize the System points on the map.
Visualization Overview
2.1 Toggle on the visibility for the Insights System layer. This will open the Legend and display System points on the map, which should all be red initially.
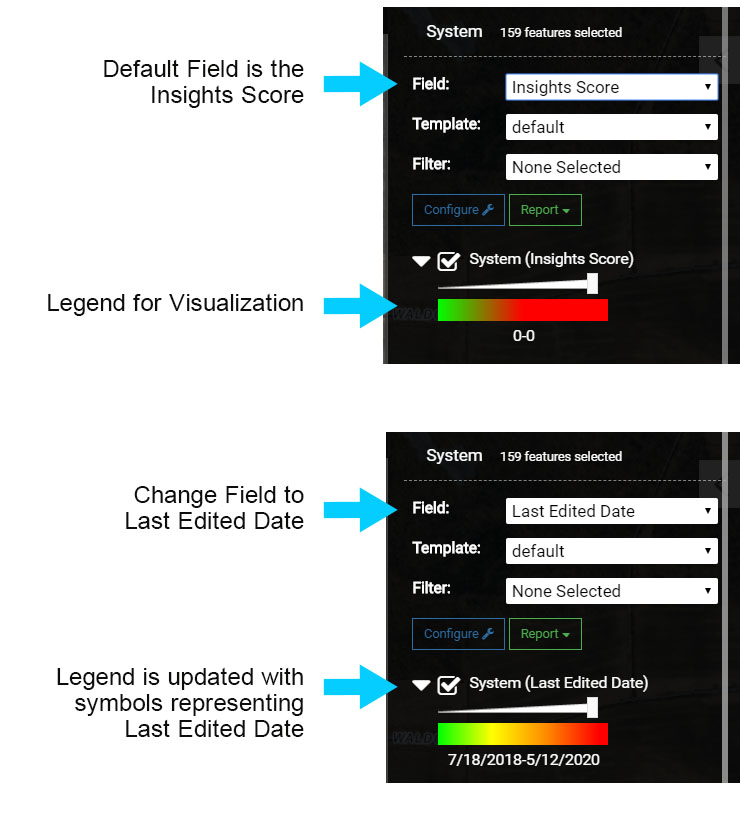
The default Visualization Field for Symbols is the 'Insights Score', but because a Scoring Template has not been defined, the System points on the map are all symbolized the same.
2.2 Change the Field to Last Edited Date or Created Date to change the Visualization.
Note that the System Legend is updated to display the symbols that correspond to the Last Edited Date values, which in the image includes a range of Date values from oldest value to newest. The System points on the map will also be symbolized according to range displayed in the Legend.
2.3 On the map, both the FetchEH layers and the Insights layers are displayed, which means you can see both the System point (Purple point) and the Insights System point.
Turn off the FetchEH layers to clean up the map. Select the 'Toggle Layers' button on the Main Menu, then locate the 'FetchEH Layers' group and toggle the visibility off.
Visualization Overview
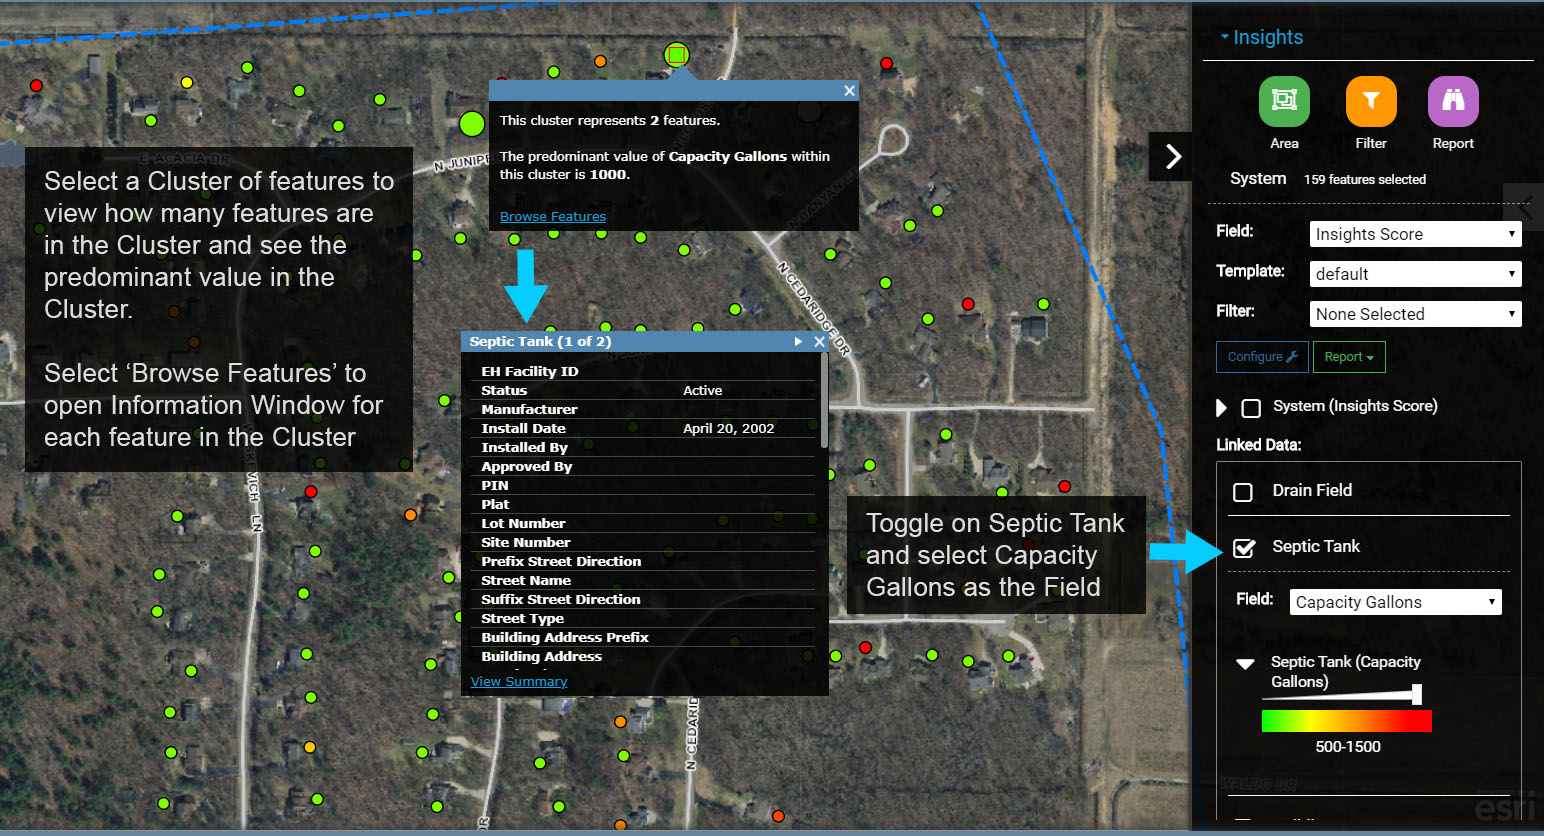
2.4 In the Visualization menu, go to Septic Tanks and select 'Capacity Gallons' or another Field, such as 'Created By'. Next, toggle on the visibility for the Insights Septic Tank layer.
Note that the Insights System Layer is turned off automatically, so the map now displays System points and symbolizes the System points using the Septic Tank 'Capaicty Gallons' value. In essence, the map is displaying Septic Tank information via the System point on the map.
The map display may cluster features depending on the zoom level. You can interact with a cluster by selecting it, which opens an Information Window and displays the count (number of Drain Fields) and the predominant or average value (depending on the data type) in the cluster.
Select 'Browse Features' to open an Information Window for each Drain Field. Note that you can use the arrow button(s) on the Information Window to page through multiple Drain Fields when applicable.
Note that some clusters will break apart to display individual Systems as the map is zoomed in. However, if a System point on the map has two Septic Tanks, the cluster will be retained as the map is zoomed in because both Septic Tanks belong to the same System point, or same location, on the map.
Septic Tank Visualization
2.5 Select a number of different Fields for the Septic Tank Visualization to see how symbology changes.
Finally, create Visualizations using other Insights layers like Septic Tank, Building or O&M.