4.5 Insights Filter
Insight Filters provide a way to segment what information will be used in a Visualization. For example, a Visualization of Septic Tanks using the Install Date Field will result in all Septic Tanks being symbolized on the map by Install Date.
However, you may want to understand the age of Septic Tanks based on gallons. This is where Filters are useful. A Filter could be created to only use Septic Tanks that are 1,000 gallons or less for the Visualization.
The Filter, when applied, will segment the Septic Tank data used for a Visualization to display only Septic Tanks that are 1,000 gallons or less, but the Visualization would still use the Install Date to symbolize the System points on the map.
Exercise Menu
Use the menu below to jump to a specific task/workflow.
- Create & Save Filters:
Create a Filter using a Query statement and then save the Filter so that it can be used routinely.
- Applying Filters:
Apply a Filter to a Visualization to segment what map features will be displayed and symbolized by the Visualization.
Create & Save Filters
This section will review creating a new Filter and saving a Filter. Filters are created by building a Query statement to segment information that will be used for a Visualization.
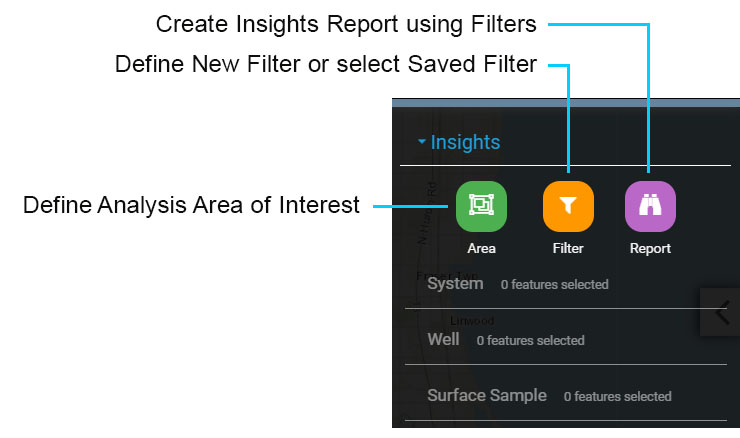
1.0 In the Insights side pane, select the 'Filter' button to open the 'Insights Filter Editor' menu.
Note that you need to have an Area on the map in order to apply a Filter and Visualize the results.
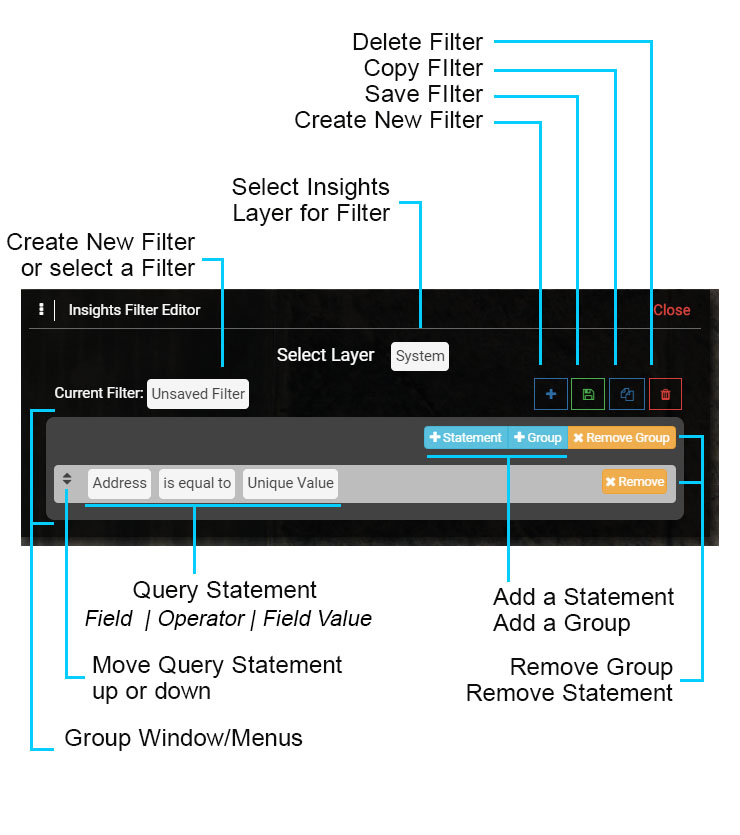
The Filter menu is used to select an existing Filter or to create a new Filter. Filters are constructed using at least one Query Statement, but may include many Query Statements organized into Groups. The Filter menu is described below:
Select Layer: before creating or selecting a Filter, select the Layer that the Filter will be applied to.
Current Filter: default setting is 'Unsaved Filter', which is used to create a new Filter. To select an existing Filter select the 'Unsaved Filter' text and a menu will appear.
Group Window: the dark gray window holds the Query Statement(s) that make up a Group. The options (+Statement, +Group, x Remove Group) are used to add new Query Statements to a Group, add a New Group and Remove the Group.
Query Statement: the light gray window is used to construct a Query Statement and includes selecting a Field - Operator - Field Value. Select the text in each cell to open the corresponding menu. The 'x Remove' button removes the corresponding Query Statement.
Delete Filter: used to delete the current Filter.
Copy Filter: used to copy an existing Filter and save it as a new Filter, where it can be modified.
Save Filter: used to save a newly created Filter or an existing Filter that is modified.
Create Filter: used to create a new Filter when the Current Filter is set to an existing or saved Filter.
Note that any saved Filter can be used for the Insights Report and Insights Filter and visa versa.
Filter Menu
1.1 Use the Filter menu to construct a Query Statement. Start by selecting 'System' as the Select Layer.
1.2 In the Query Statement, select the Field cell ('Address') and scroll down the menu to located Septic Tank, then select 'Capacity Gallons' for the Field.
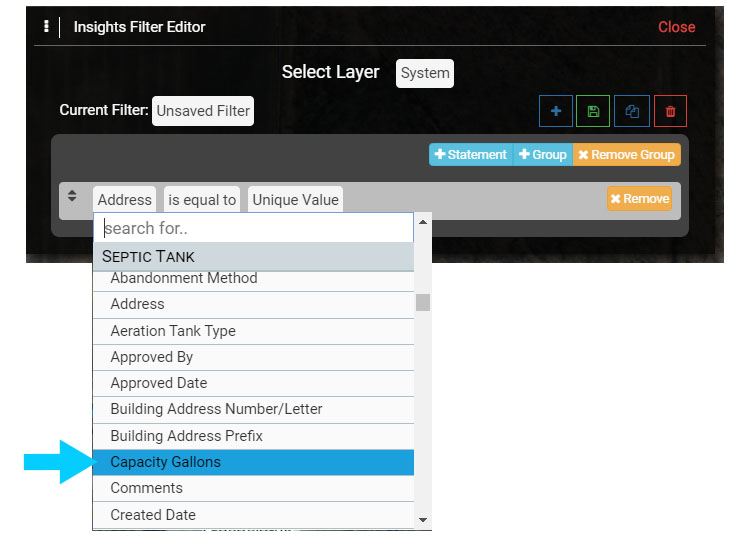
1.3 In the Operator cell select 'is less than'.
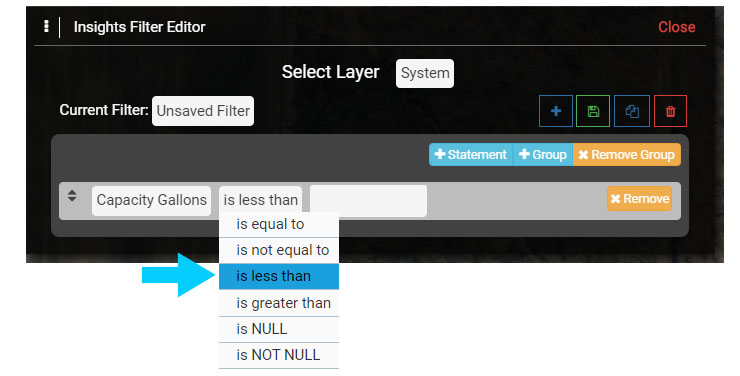
1.4 In the Value cell enter '1000'. Note that if there are Values in a Field, such as Created User, the Created User names will be auto populated in the Values menu.
Once you have entered the Value the text in the Query Statement will turn green. The finished Query Statement should appear as displayed below.
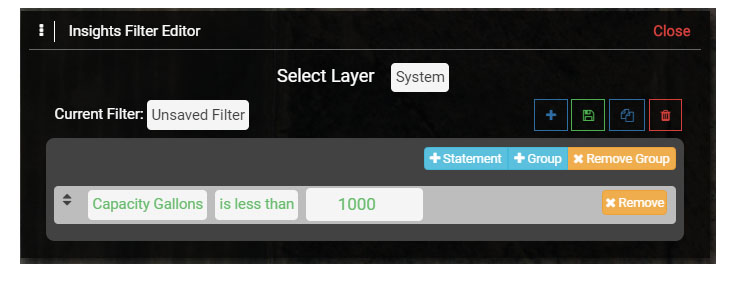
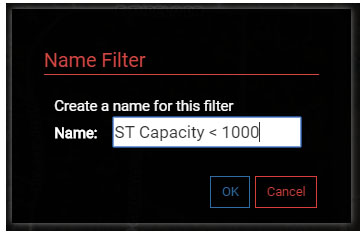
1.5 You could continue to add Query Statements, including creating Groups to introduce even more complex questions, but for now save the Filter by selecting the Save button in the Filter menu. Name the filter 'ST Capacity < 1000' and select OK to save it.
Note that after you save the Filter the Current Filter is 'ST Capacity < 1000'. If you wanted to create another new Filter, you would select the Create New Filter button.
Applying a Filter
Once a Filter is created and saved it can be used with Visualizations to filter or segment what Systems are used in the Visualization. It is important to note that Filters only refine what is being displayed by a Visualization. Filters do not determine the Field or corresponding values used for a Visualization and subsequent symbology displayed on the map.
2.0 In the side pane, select the Septic Tank Insights layer and toggle on the visibility.
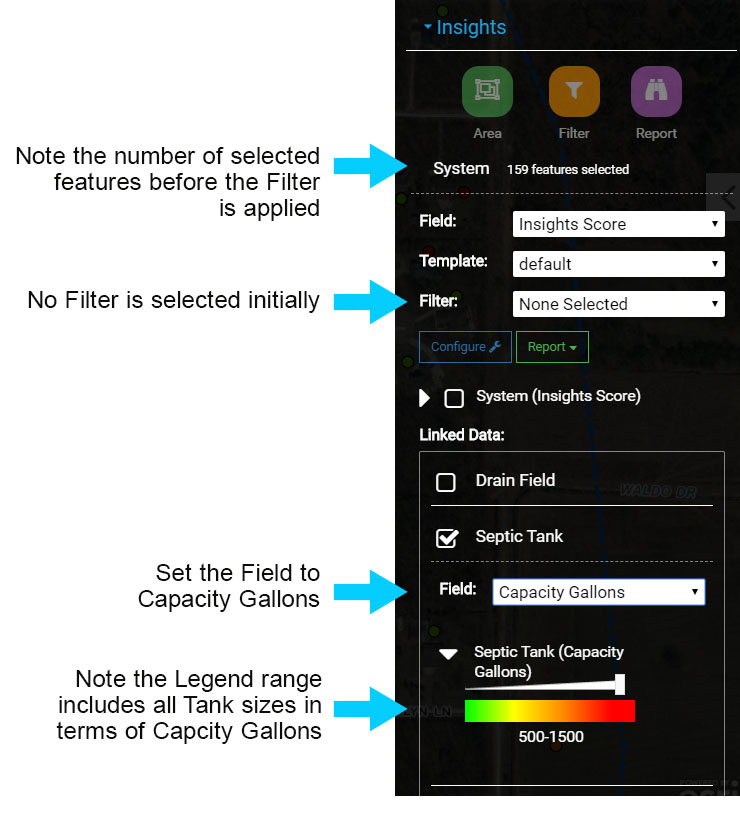
2.1 In the 'Field' menu, select 'Capacity Gallons'. This will symbolize System points on the map according to the 'Capacity Gallons' of any Septic Tank managed under a corresponding System point.
The current Visualization includes all Septic Tanks because no Filter has been applied.
Note the number of features selected next to System (in the image 'System 159 features selected') and the range in the Legend below Septic Tanks. The Legend will show all Septic Tank Capacity Gallon values in the range, in the image the range is 500 - 1500.
No Filter Applied
2.2 Next, apply a Filter to segment the data used to create the Visualization.
In the Filter menu select the Filter you saved ('Septic Tank < 1000'). Selecting the Filter will apply it to the Visualization.
The Filter will result in displaying only System points that have a Septic Tank with a Capacity Gallons less than 1000 gallons. The Visualization symbolizes System points based on the Field Capacity Gallons.
Note that number of selected features in the image is now 3 and that the Legend displays the correct range of 500 - 850, with 850 being the largest Capacity Gallons under the 1000 gallon Filter.
2.3 Change the Septic Tank Field to a Date, such as Installed Date or Created Date.
The resulting Visualization is still only displaying System points that meet the Filter - Septic Tanks with a Capacity less than 1000 gallons, but the Visualization now symbolizes the System points using the Date Field values.
2.4 Toggle on the Insights Drain Field layer and set the Field to 'Type' or another Field that has values, such as Created Date or Created User.
In this example the Visualization is still only displaying System points that meet the Filter (Septic Tanks with a Capacity Gallons less than 1000), but here the Visualization symbolizes the System points using the Drain Field Type.
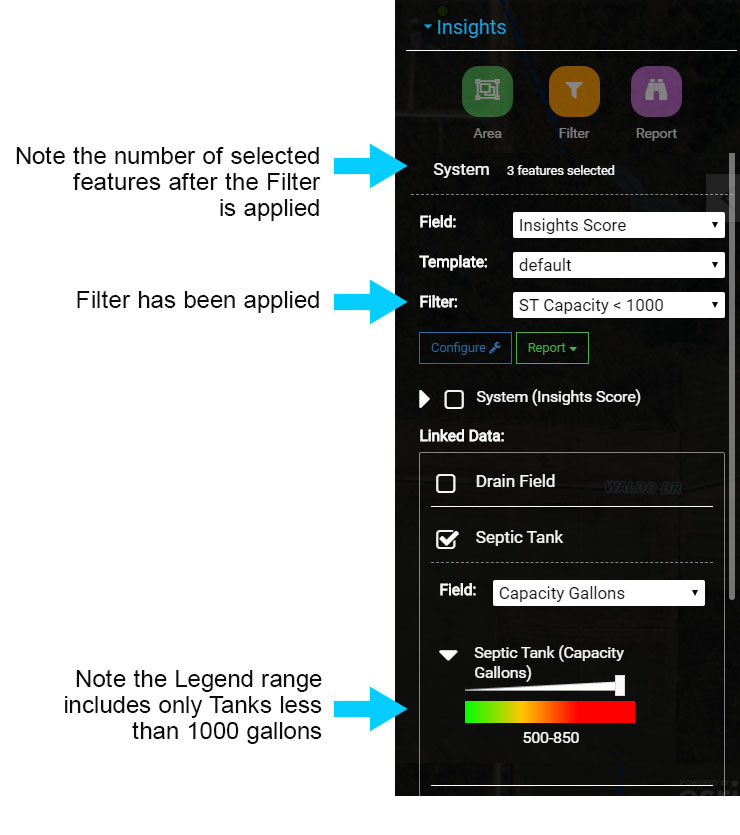
Filter Applied
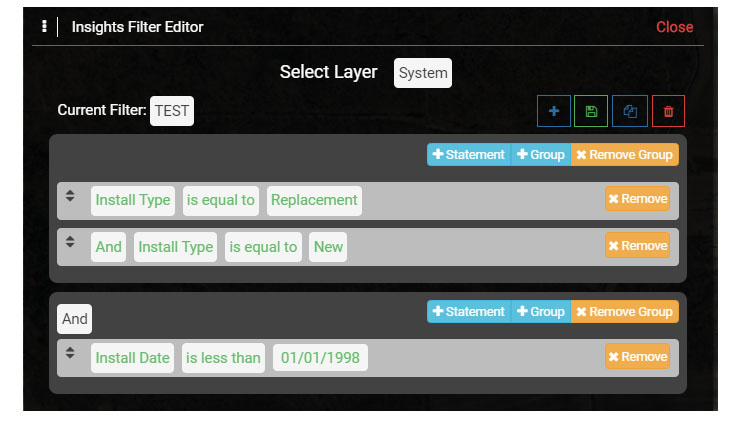
2.5 Try building additional Filters to segment the data that is used for a Visualization. Create a Filter with multiple Query Statements and Group Query Statements create more complex Filters.
One example is to create a Filter where the Septic Tank Install Type is Replacement and the Drain Field Install Type is New. The first set of Query Statements can be Grouped, and then a second Group can be created and contain a Query Statement that introduces a Date, such as Drain Field Install Date greater than some Date.