Special Projects
Developing location based onsite wastewater inventory
Special Projects, Bay County, MI - October.2020
Project Summary
Now that we have completed mapping onsite systems in Bay County, we thought we would provide some initial summary information for the project. Revisiting the original intent, our role in the project was to develop a county-wide, location-based inventory of onsite wastewater systems with an initial focus on the Kawkawlin River Watershed. In short, review every available onsite wastewater system permit (PDF and paper), map it where possible and enter relevant information about the onsite system, such as tank type/size, drainbed type/size, install date and more.
The core idea was that a location-based onsite system inventory could provide many benefits to Bay County or any other community, including understanding the inventory better, improving access to onsite information and using data to inform decisions and strategies aimed at protecting public health and water quality. While it is still early, we completed mapping and QA/QC in September, the initial results have been positive.
Early Benefits
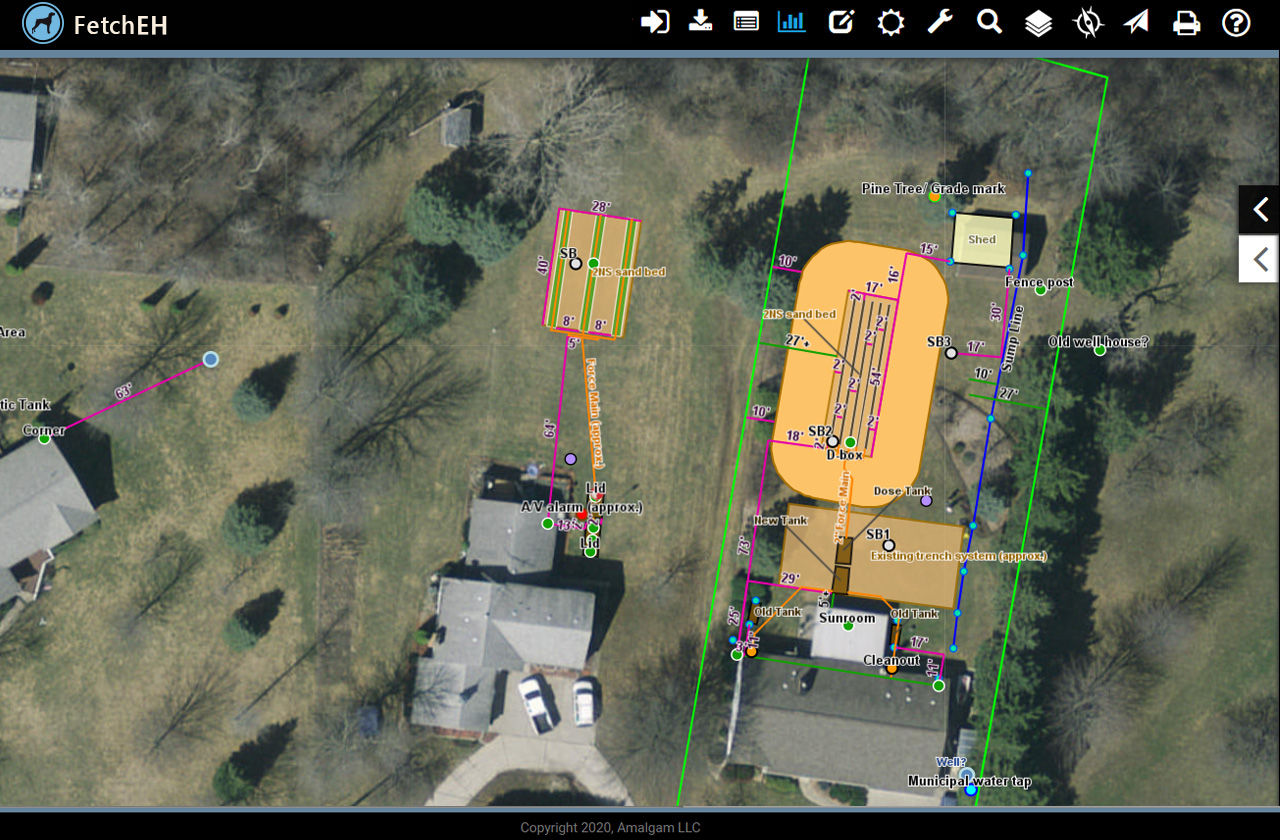
To start, simply seeing onsite systems on a map, many with complete site plans, and interacting with them to access information has proved valuable. The mapped inventory makes it easier to locate/site new or replacement systems by understanding the surrounding parcels and onsite systems, it has made accessing information about a particular onsite system easier, including viewing system information, scanned permits and any pictures, and it has improved how information is shared within the department.
Improved Access to Onsite System Information
Looking at more advanced tools, Bay County is in the early stages of using FetchEH Insights to better understand the onsite inventory, but early feedback is that these tools have already added value. For example, using filters and reports to mine out information has provided useful insights about where information about onsite systems is missing or incomplete. Staff then conduct field visits to fill in the missing or incomplete information, prioritizing target areas like the Kawkawlin River Watershed.
The inventory itself, along with Insights tools in FetchEH, have also helped Bay County pursue additional grant funds that will ultimately help upgrade failing or compromised onsite systems. In this instance, the data will be used to help categorize the inventory based on some criterion, track upgrades and replacements and monitor impacts to the inventory.
Longer term benefits, such as the impact to public health and water quality will be better understood in the future. That said, the onsite system inventory and the tools in FetchEH provide the opportunity to use data and location to inform decisions and strategies, and track the results of any management strategy.
Mapping Summary
Looking at the mapped inventory itself, the initial estimate was that there would be approximately 12,000 onsite systems mapped. This was pretty much spot on as noted below along with some other summary information we put together:
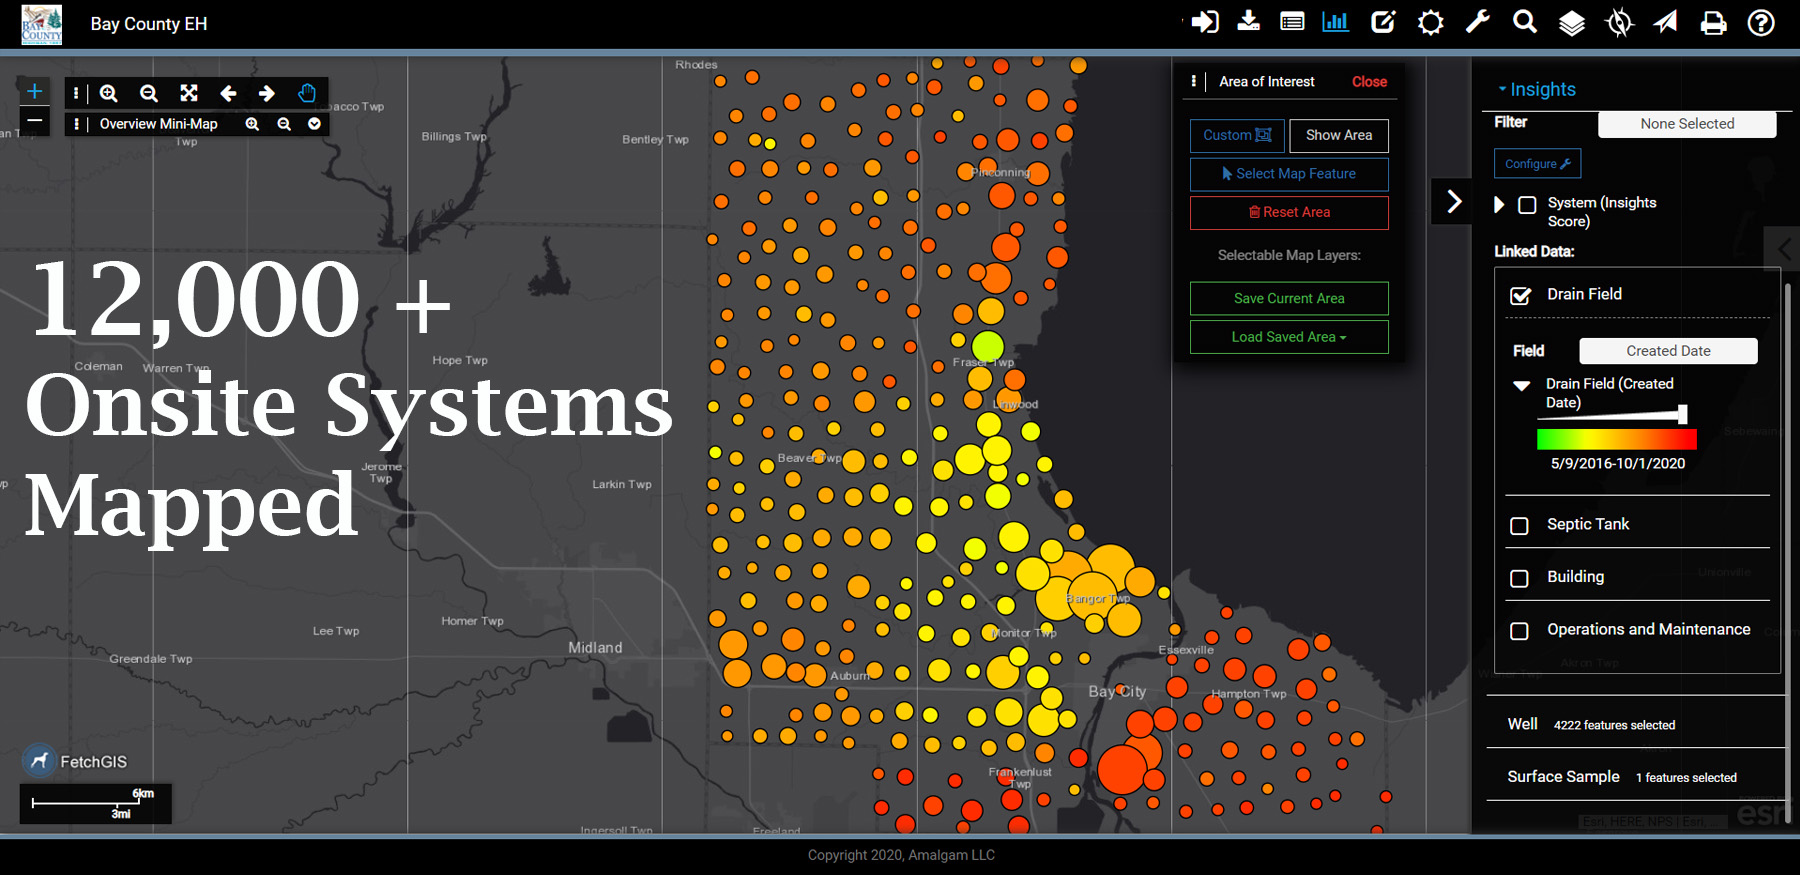
Onsite Systems Mapped by Date
Overview
Total Onsite Systems Mapped: 12,265
The total number of System Points on the map, which includes entering system components and relevant system/component information.
Site Plans Mapped in Detail: 4,786
The total number of System Points where the final site plan was mapped in detail, meaning the tank, disposal area and any measurements were mapped according to measurements on the site plan and/or using evidence in aerial imagery.
System Points Mapped without Site Plan Mapped: 7,479
The total number of System Points where the final site plan could not be mapped, but any system components and relevant system/component information were added.
Permits Scanned, Not Mapped: 1,843
Permits that could not be located using address or other property information on the permit, or were missing an address or other property information. Note that many of these permits did not have a final and may have only been proposed systems. For those that were installed, there map also be replacement permits that have captured the onsite system information.
Permits Not Scanned or Mapped: 229
Same as above, but these permits were not scanned and only in paper format.
Permits Scanned and Mapped, but Paper Copy Missing: 38
Permits that were scanned and mapped, but where a paper copy of the permit was not present.
Total Scanned/Paper Permits: 14,108
The project resulted in mapping approximately 87% of the scanned/paper permits on file.
Missing/Incomplete Information
Systems with No Age on Septic Tank or Drainbed: 592
Drainbed Type Unknown: 208
Drainbed Size Unknown: 549
Septic Tank Type Unknown: 414
Septic Tank Size Unknown: 986
Age Breakdown (Drainbed)
Drainbed Age Greater Than 40 Years: 5,906
Drainbed Age 20 – 40 Years: 3,012
Drainbed Age Less Than 20 Years: 1,914
Note: the age of the inventory includes approximately 2,200 Onsite Systems older than 40 years that are located where sewer connections now exist. There are also approximately 375 Onsite Systems between 20 and 40 years old that are also located where sewer connections now exist.