Well Water
Permitting plus tools to use your data
Do more with your well data
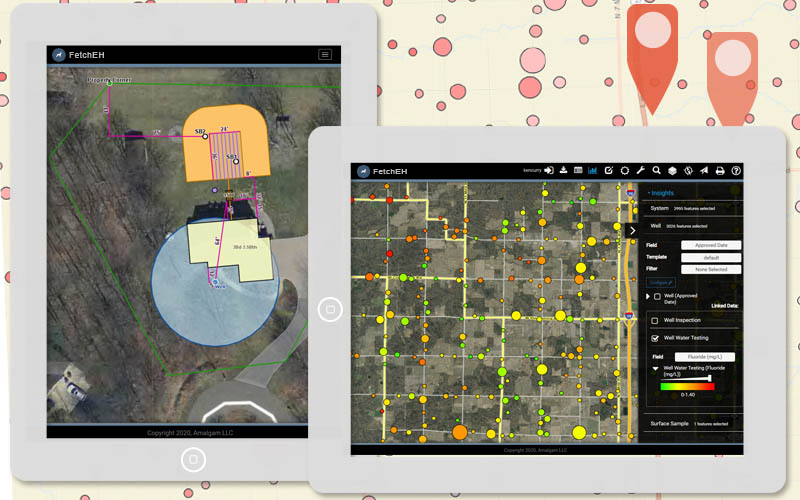
Capturing important information through the permit and inspection workflows is just the start of data process in FetchEH. After you collect data about wells, use it with filters, reports and map visualizations to discover new insights that help you see a different view of your wells and protect water quality.
Adding context to the picture
From planning the location of new or replacement septic systems and wells, to accessing well permit information, water sample results and inspection history, integrating well water data as a resource helps you see the complete picture.
Issue permits, track status and inspections through the final approval.
Map the well on the map where it is actually located on the property.
Interact with wells on the map to access system information.
Provide public access to citizens, contractors, Realtors and more.
Use reports and visualizations to ask questions about your well data, map water sample contaminants and identify potential issues.
Track operations and maintenance events, like time of transfer inspections to build a complete history of a well.
Core Capabilities
Permitting with a focus on using your data and location to do more, improve access and see results
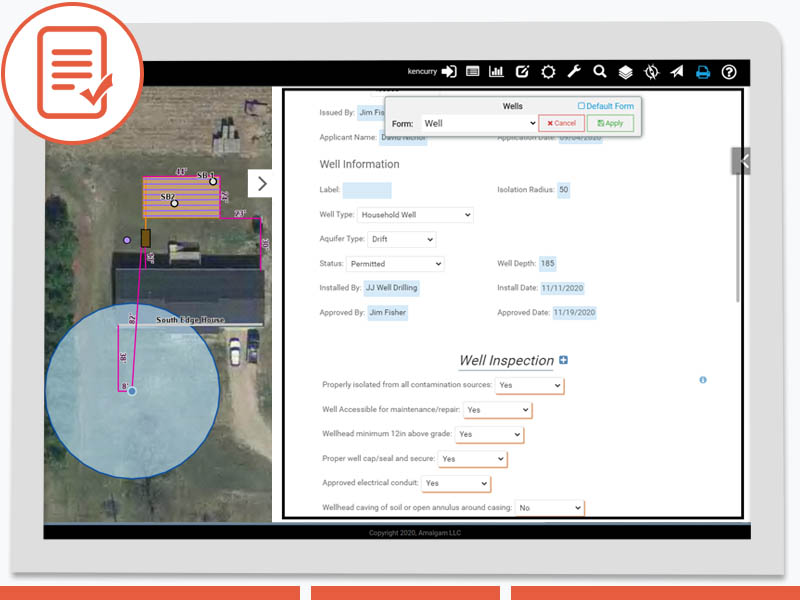
Permitting
Create your own well permits or get started with our default options. Then move from issuing a well permit, to inspections and entering water sample results seamlessly. Collect the data that is right for your workflow at every step in the process, including adding time of sale inspections to build a complete history of any well.
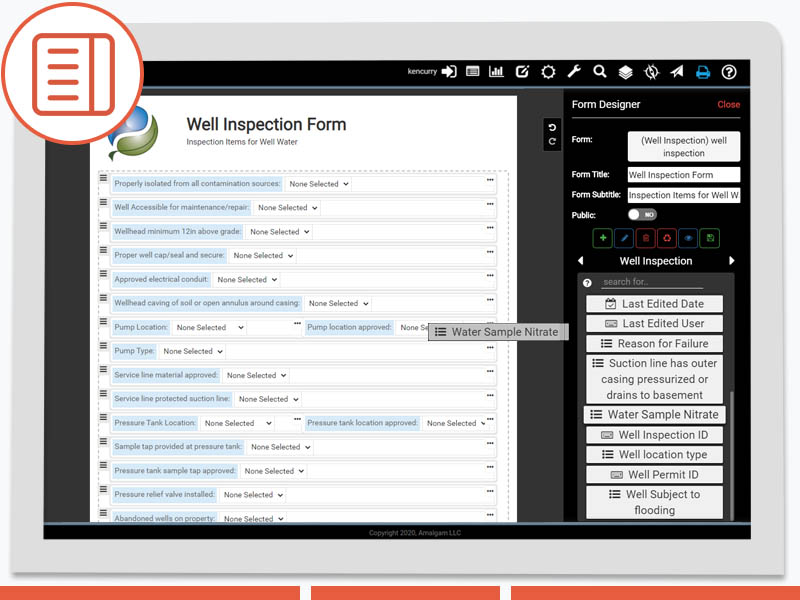
Form Designer
Build the forms that meet your well permitting, inspection and water sample workflows. Easy to use design tools give you control over arranging fields, adding title and sub-title, modifying font size, setting default values, setting required fields, building auto fill lists and more.
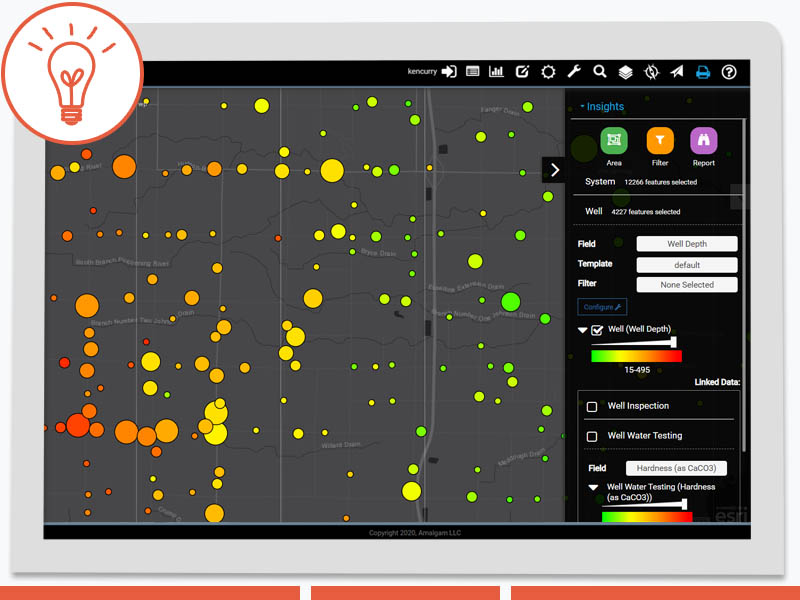
Insights
Understand the well water data you collect using reports, filters and visualizations. See potential issues like high nitrate levels, where hardwater is more likely, well depth, pump type and more. Save reports and filters to use again, visualize any data you collect to discover new insights and integrate management strategies that mitigate potential problems.