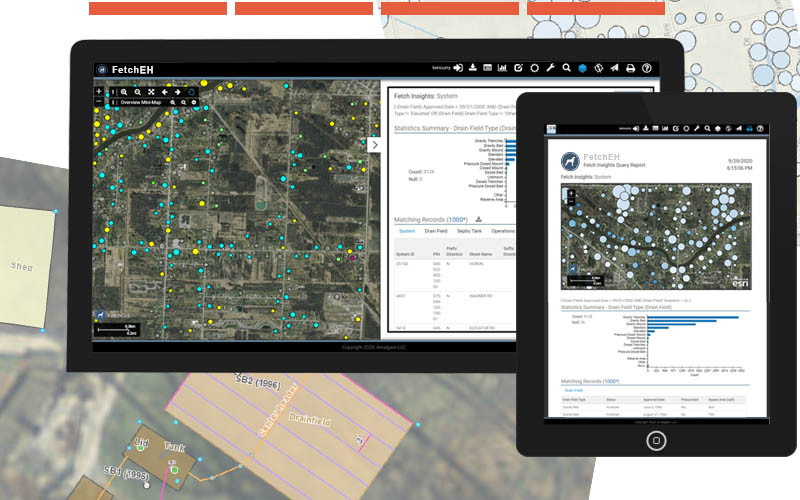
Insights
Adding data and location to the EH equation
Data Value
We believe that your data has value and our mission is to enable environmental health professionals to create good, location aware data, that contributes to becoming operationally more efficient, and to gain useful insights about the data they manage. Start using data to improve environmental health outcomes.
Revealing hidden details
Data created from food and onsite wastewater workflows can provide additional benefits when applied as a management tool. With FetchEH, there are now tools designed to extend the value of your data to learn more, see more and do more.
Automatically create powerful map visualizations using EH data that you manage.
Apply filters to ask questions that are simple or complex, and discover new details.
Create reports for structured output, complete with summary information, results list and a map displaying features that match your report filters.
Communicate the issues and your ideas visually, let people see what you trying to convey.
Insights are the one tool that truly leverage your data, your investment, and put it to work for you and your community.
Core Capabilities
Insights are the key that opens the door to using your EH data as a management tool
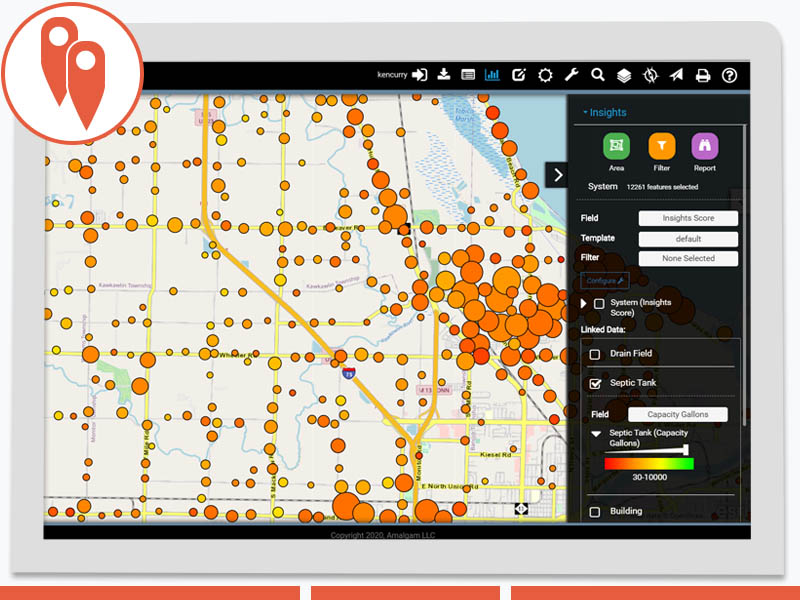
Visualization
Visualizing your EH data on a map helps communicate operational and community wide status, issues and planning. Displaying EH data on the map in the simplest form is a visualization, which symbolizes data based on some field and the values in that field. Symbolizing data on the map is done automatically, so you don't need expertise in GIS or mapping to see what is happening. Visualizations may also be segmented to focus on a specific question or aspect of your data using filters.
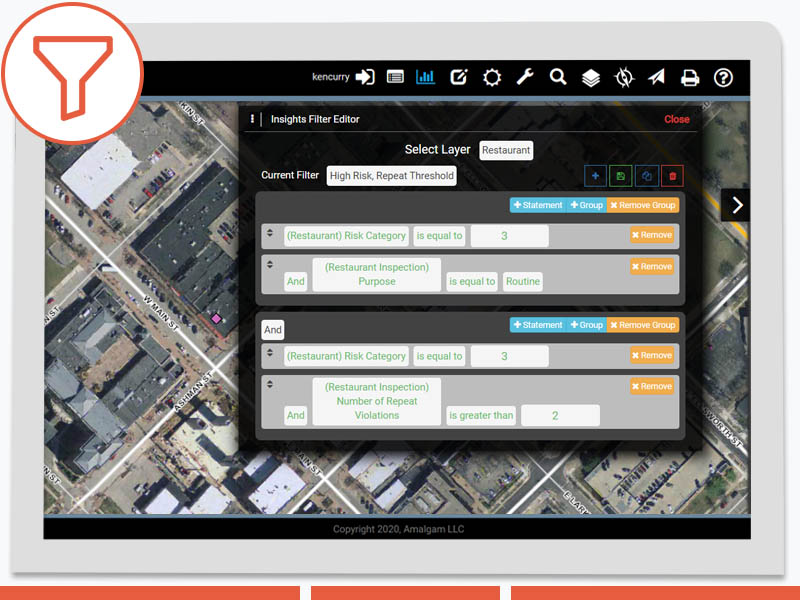
Filters
Filters are applied to a visualization to segment the data that is displayed on a map, like only display onsite systems with septic tanks more than 20 years old. Filters are made up of a single query statement, or multiple statements for more complex questions or segmentation of data. Any filter that is created can be saved for later use, and be used for a report.
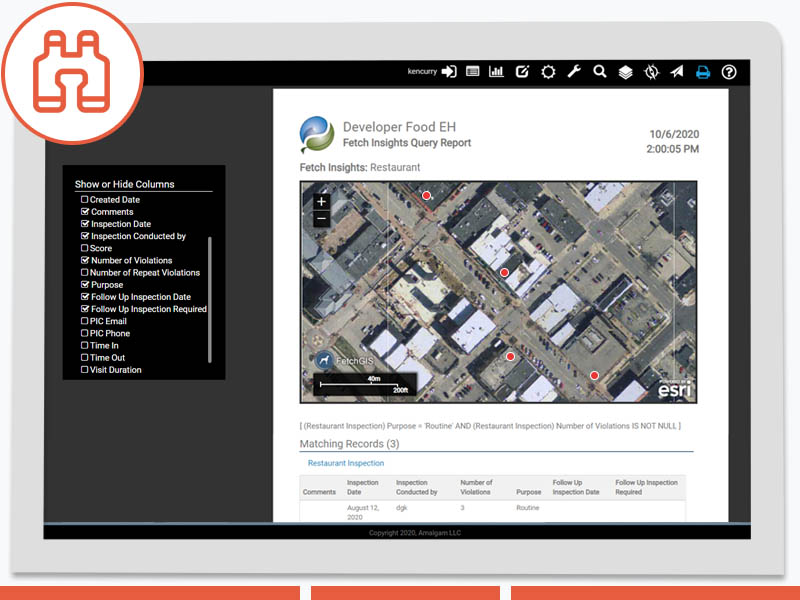
Reports
Reports provide the ability to create structured output (PDF), including summary chart, exportable results list and displaying data on the map. Reports are constructed using a filter with a query statement(s) designed to ask a question or target specific parts of your EH data. Because a report uses filters to segment EH data, they can be saved and used again without having to re-build them each use.