Special Projects
Developing location based onsite wastewater inventory
Special Projects, Bay County, MI - April.2020
Insights II - Filters
In the first Insights post we introduced the idea of defining an area of interest on the map and visualizing onsite system data based on a system characteristic, such as the install date of the disposal area or size of the septic tank. Data visualizations are an effective option for understanding the characteristics of your onsite system inventory. In this post we will extend the power of data visualizations by applying filters to further segment or qualify the onsite systems and characteristics we want to visualize.
Filters
In the last post we applied visualizations to all onsite systems in the inventory, but what if we only wanted to visualize a subset of our onsite inventory. For example, what if we only wanted to visualize systems installed prior to a specific date or only systems that have replacement disposal areas. This is where filtering comes in.
Filters provide the ability to segment visualizations so that we only see systems that match the terms defined in the filter. From there, we can visualize that subset of systems based on any number of characteristics, such as age, size, type and more. We can also save filters so they can be used on a recurring basis and by other regulators.
Below are a few examples of how filters can be used:
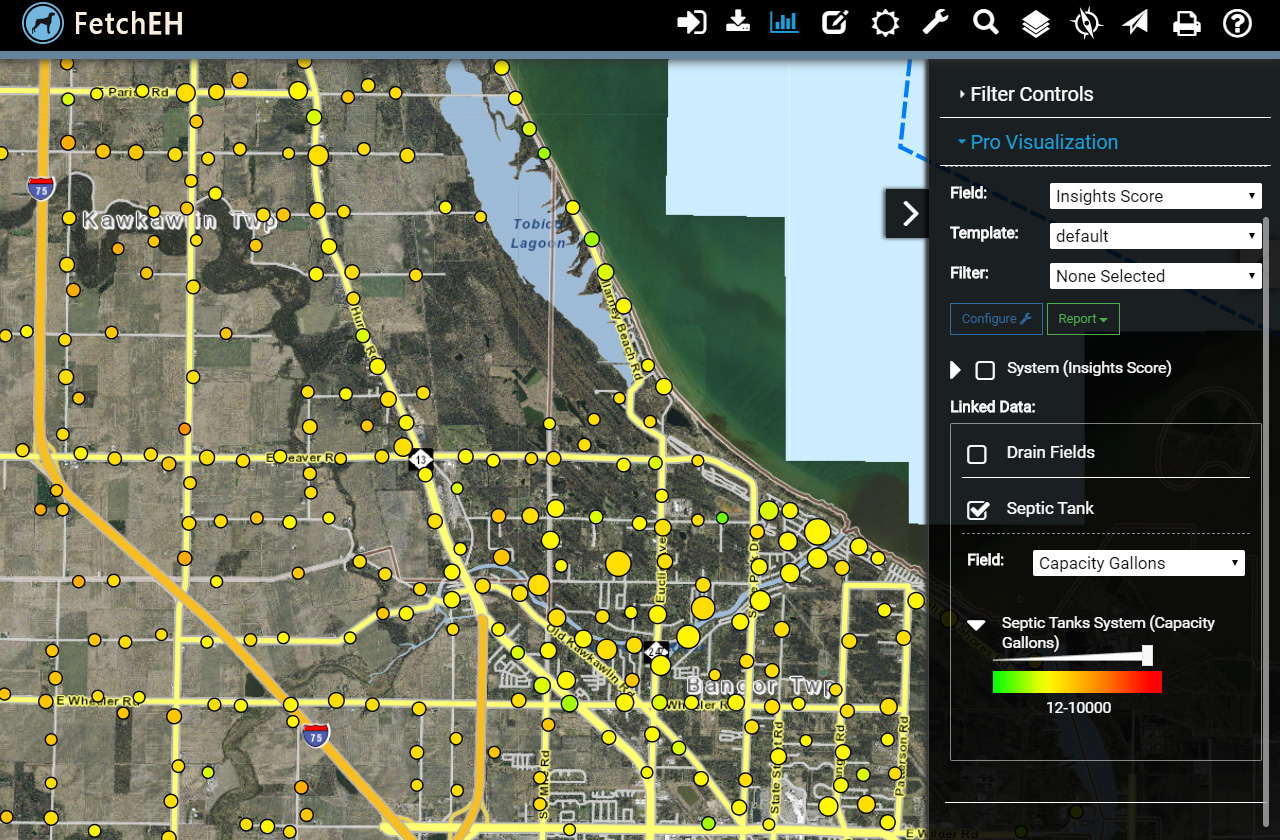
Area of Interest
The image displays the area of interest that we will be working in initially, which means the filters and visualizations will be applied to only those onsite systems that are inside the area of interest.
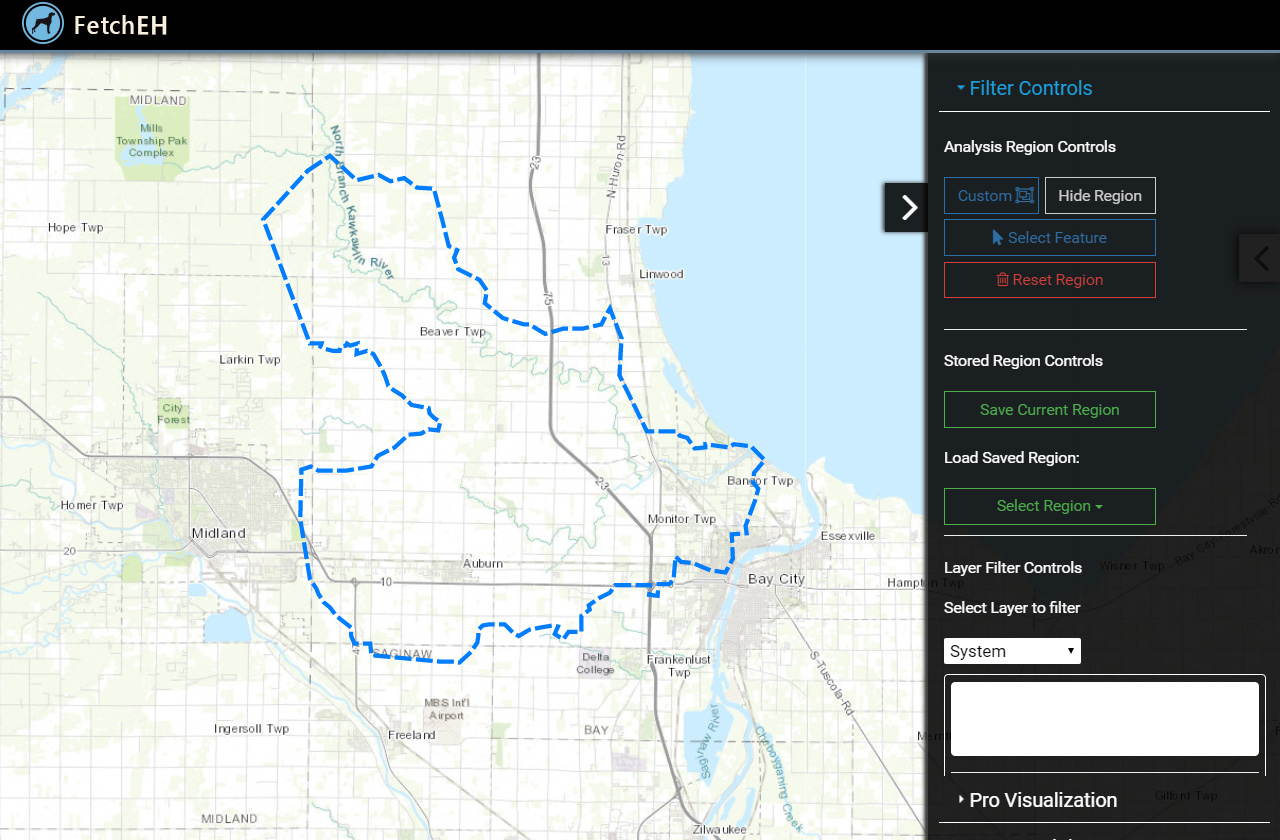
Defining Area of Interest
Filter by Age
The first image below displays onsite systems by the age of the disposal area with no filter applied. The second image also displays onsite systems by the age of the disposal area, but in this example a filter has been applied to only visualize systems where the disposal area is more than 30 years old, or those installed prior to January 1, 1990.
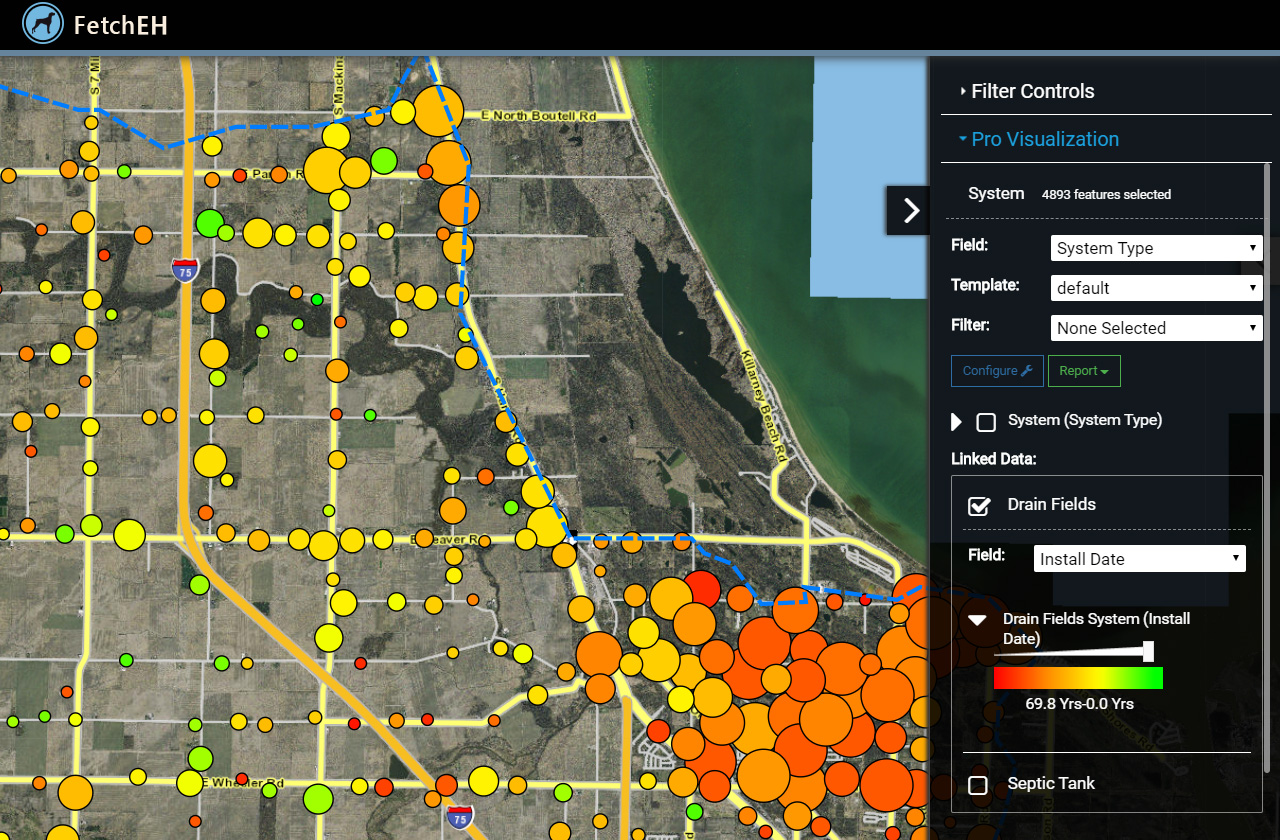
Visualizing Age of Drain Field - No Filter Applied
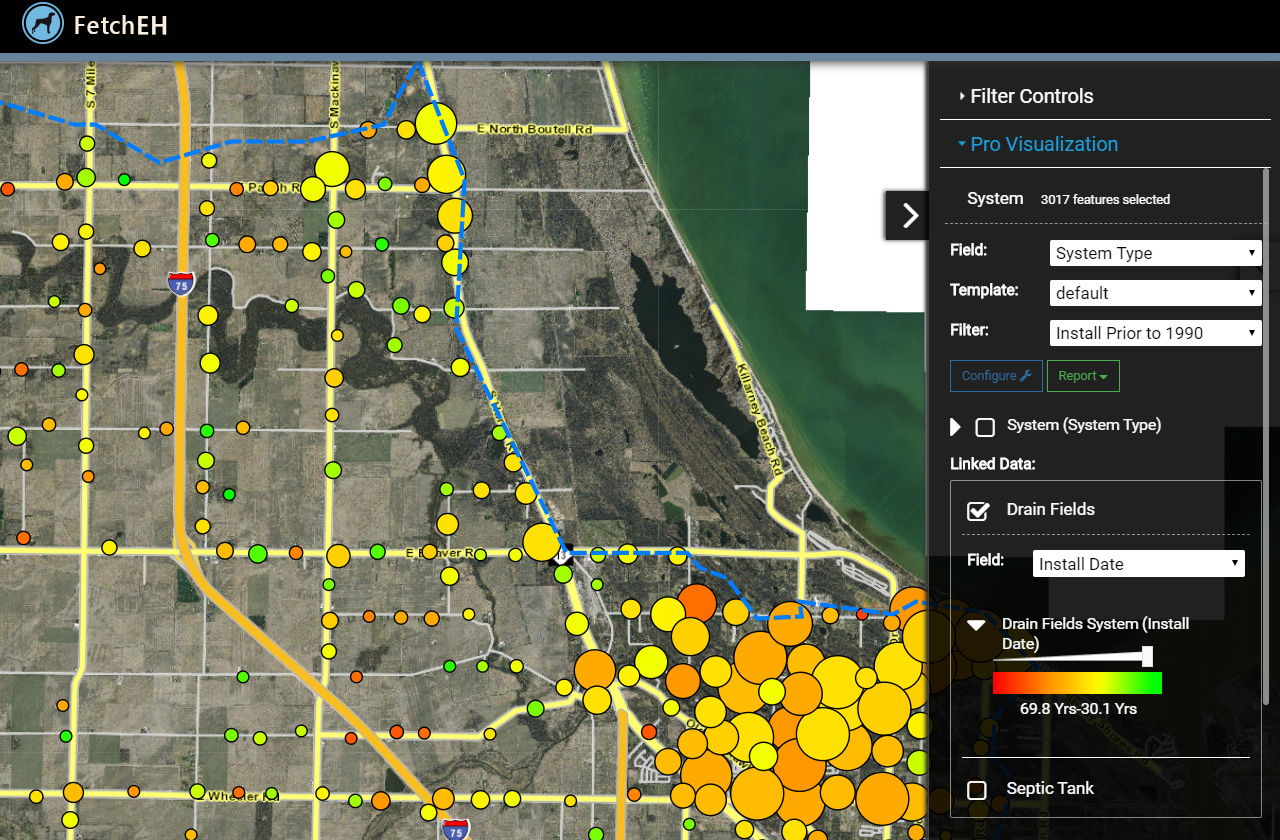
Visualizing Age of Drain Field - Filter: Age > 30 Years
Filter Septic Tank Size
The first image displays onsite systems by age of the septic tank, with a filter applied to only visualize septic tanks smaller than 1000 gallons. In the second image a filter is applied to only visualize systems where the septic tank is greater than 1199 gallons.
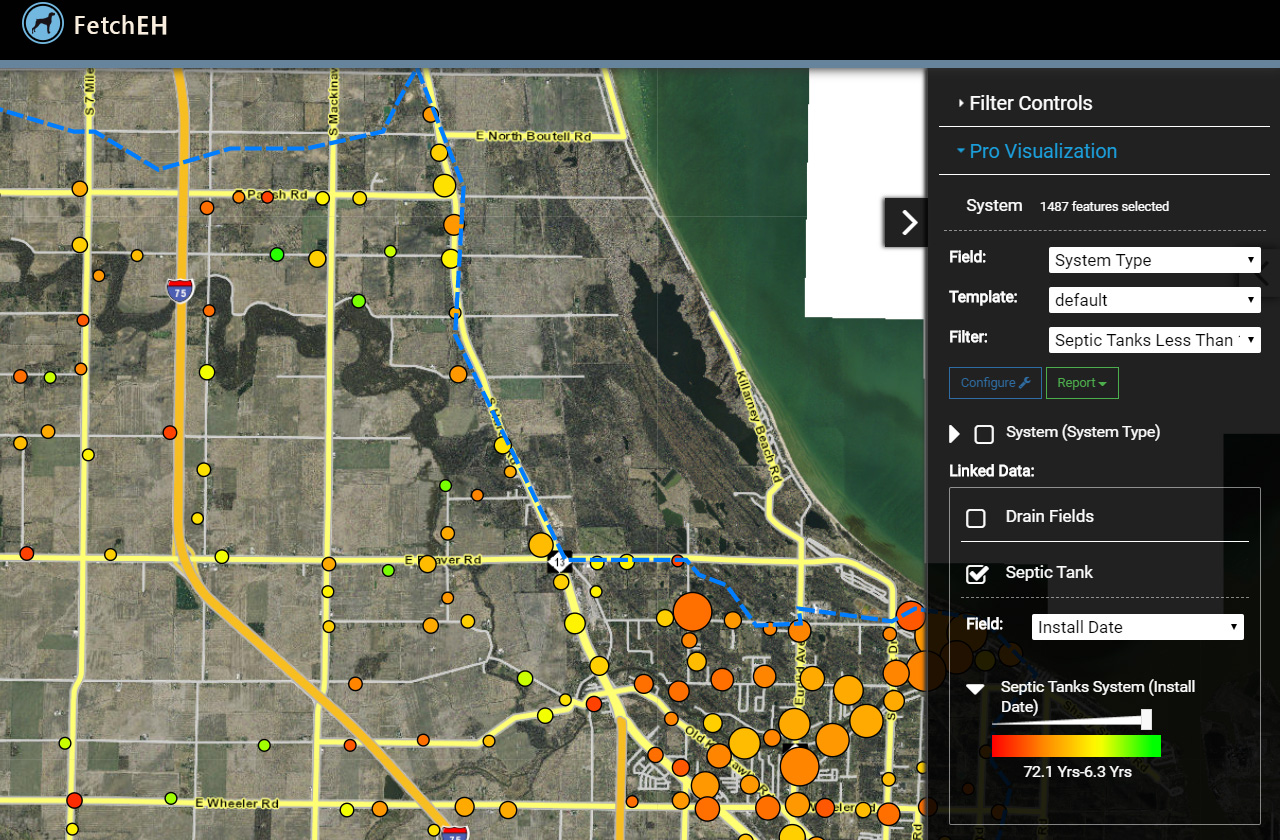
Visualizing Age of Septic Tank - Filter: Tank Capacity < 1000 Gallons
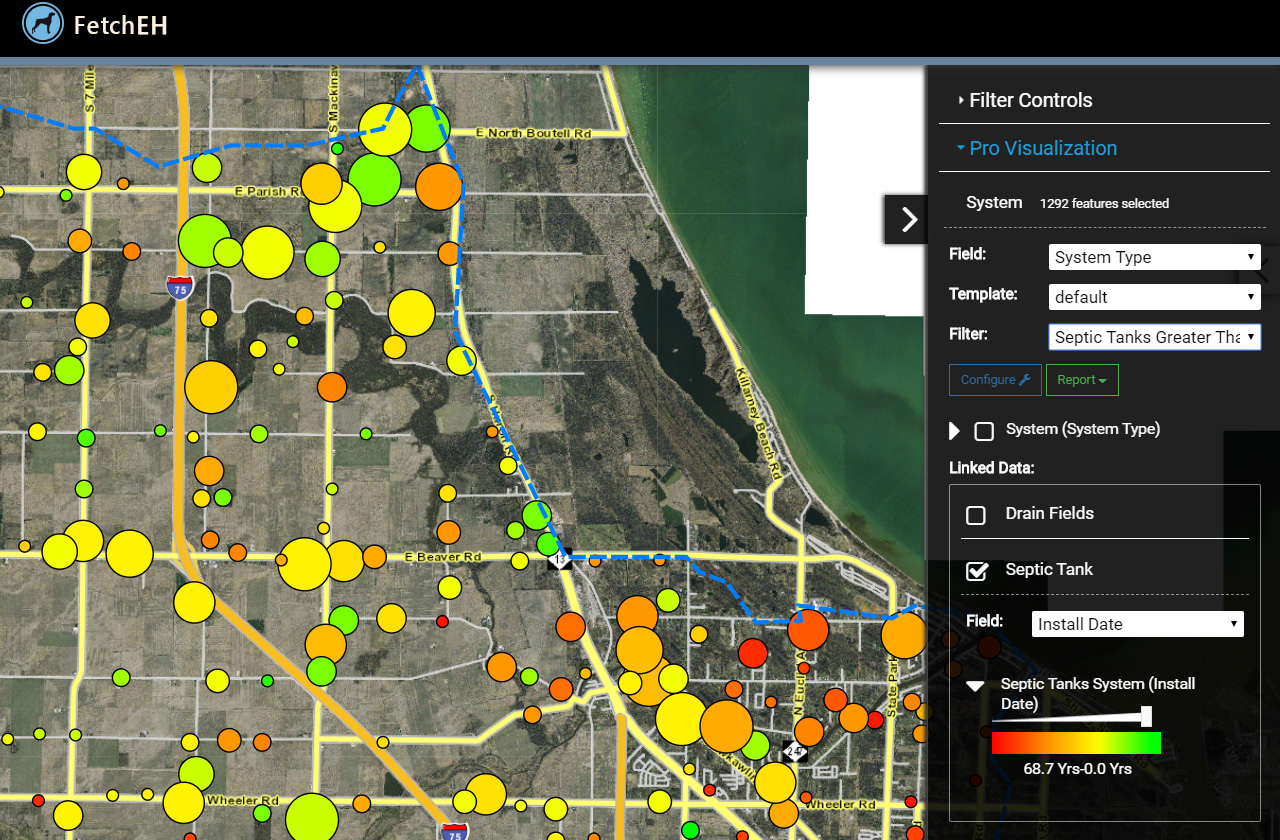
Visualizing Age of Septic Tank - Filter: Tank Capacity > 1199 Gallons
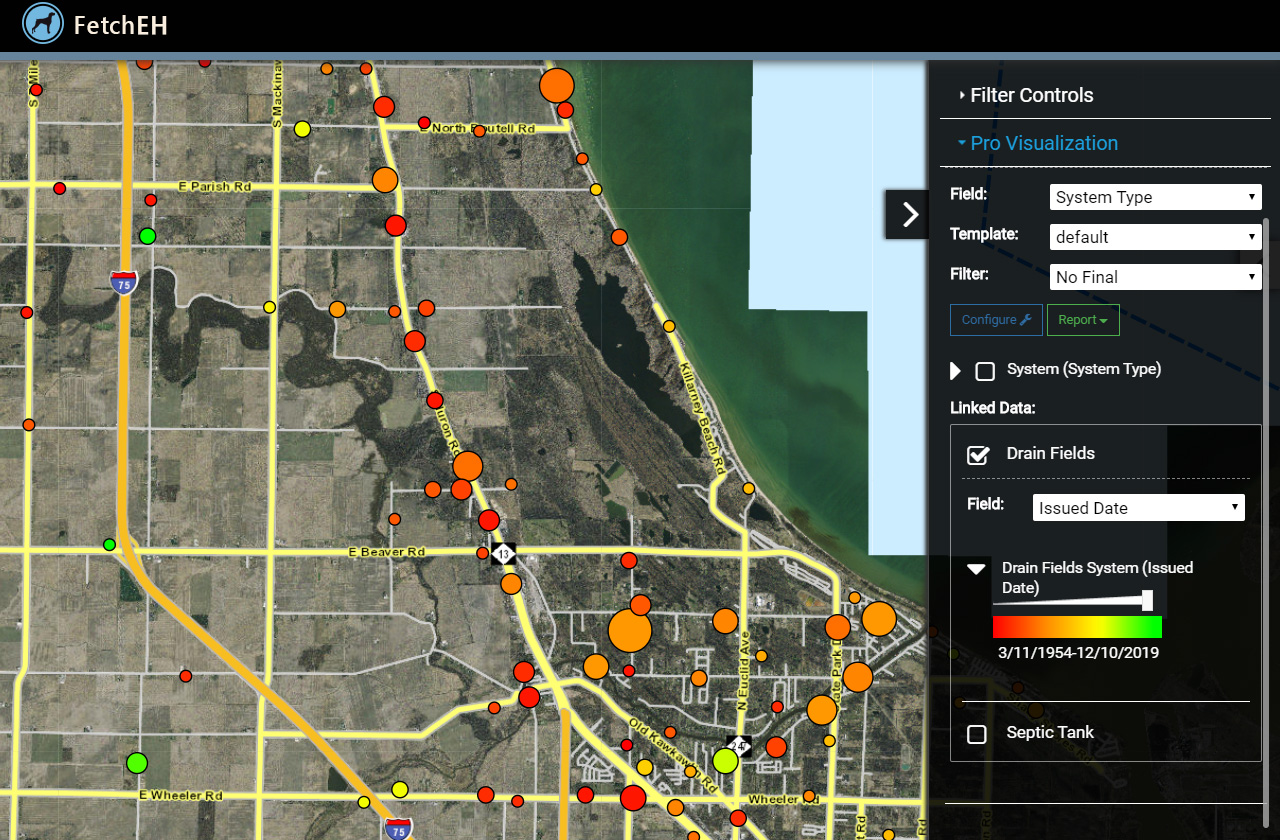
Filter by Permit Status
The image below displays onsite systems by age of the disposal area, with filter applied to visualize only disposal areas without a final inspection on record.
Visualizing Onsite Systems by Installation Type
Installation Type: here we are visualizing the type of installation for septic tanks.
Visualization: Age of Disposal Area - Filter: No Final Approval on Record
Filters are a powerful option for segmenting the data we want to apply to visualizations. The use of a filter extends how data visualizations are used, enabling a deeper understanding of systems based on specific characteristics about system components, or even operations and maintenance events. In the next post we will continue our look at Insight based tools in FetchEH and explore the Query tools.