EH Bellman
Location, data and EH. A better way forward.
EH Bellman - May.23.2022
Calculating ROI for Replacing Septic Systems
Measuring the impact of replacing problematic septic systems is useful for demonstrating the return on investment (ROI) from grant funding, or other programs like time of transfer and routine maintenance. Integrating a process to measure return on investment in FetchEH became a focal point for the Bay County Health Department, who received grant funding to help replace problematic septic systems in the community. The grant required having a process to assess how funding improved public health and the environment, and recommended a tool called the Septic System Improvement Estimator (SSIE) to evaluate ROI.
Septic System Improvement Estimator
The SSIE tool was developed by University of Minnesota’s Water Resources Center for the purpose of estimating how replacing problematic septic systems reduces pollution load. Using the SSIE tool provides a standard approach to evaluating the reduction of pollutants, which can then be tied to grant funding to determine the ROI. After several conversations, we went to work and integrated the SSIE tool in FetchEH. The integration provided Bay County the ability to enter and track SSIE data in FetchEH, and then apply the data to create map visualizations and reports to better understand and communicate the benefits of the grant project.
Determining pollution load removal with the SSIE tool begins by entering the number bedrooms and an existing septic system code, which corresponds to a public health or safety threat, or a system that is compliant. Calculating the actual pollutant load removal occurs when a new system code is entered, which represents the replacement septic system or connection to a wastewater treatment facility. The SSIE tool can also be used to evaluate the lack of a management program, homeowner education, comprehensive septic system inventory, property transfer and more. These programs increase or decrease pollutant load reduction by a specified percentage.
The SSIE tool measures pollution load removal for the following contaminants of concern:
- Biochemical oxygen demand, five-day (BOD)
- Solids, total suspended (TSS)
- Coliform bacteria, fecal
- Phosphorus (P)
- Nitrogen (N)
Early Results
Bay County has entered SSIE data for more than a dozen systems that have been replaced with assistance from the grant. The SSIE tool has provided a standard method for measuring pollutant load removal, which helps Bay County and grant administrators understand the benefit or ROI from the grant funding. Integrating SSIE data in FetchEH provided additional benefits by enabling new insights, and opportunities to communicate and understand SSIE and grant information.
Below are examples of how SSIE and grant information is used in FetchEH for new insights and visually communicating results. Note that the map visualizations and reporting are constrained to the Kawkawlin Watershed, which is a primary target of the grant project.
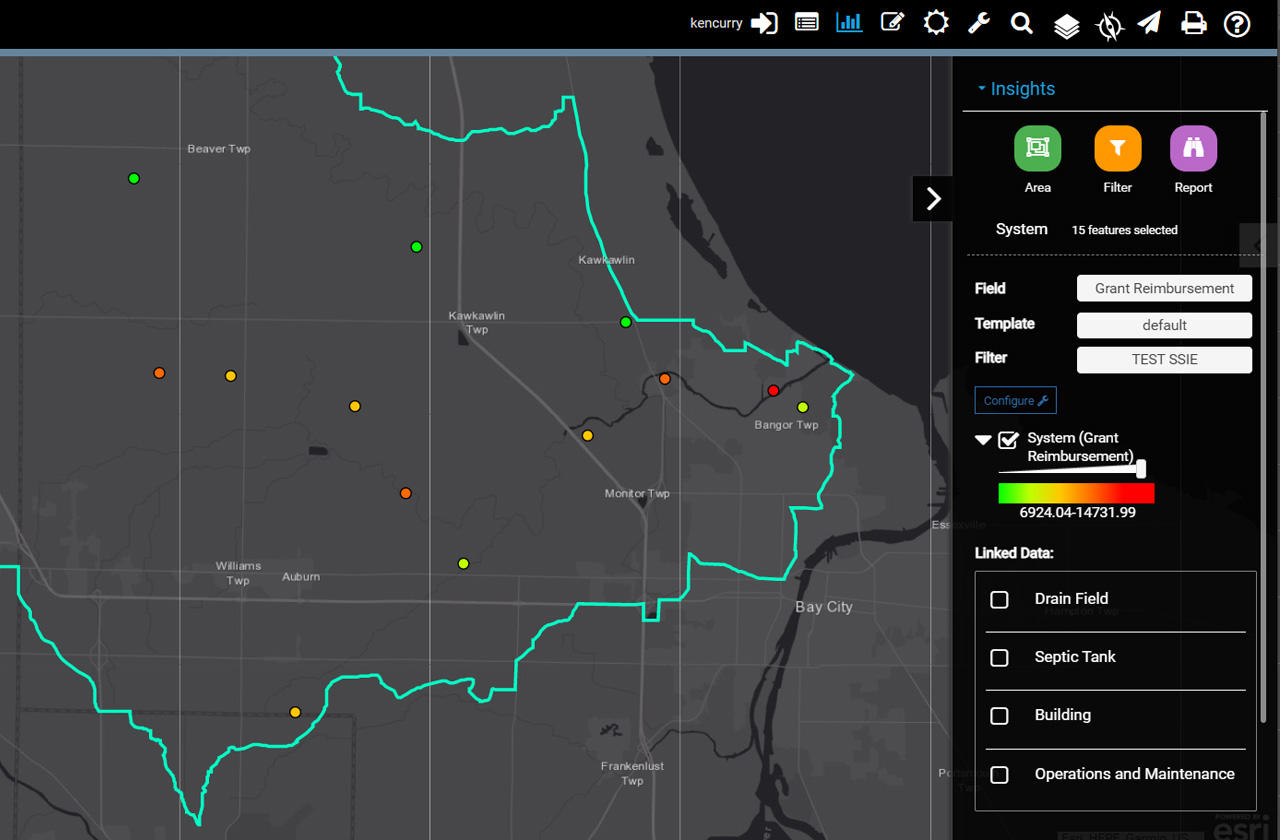
Grant Reimbursement
The image above displays how much funding each homeowner received from the grant. Funding was used to replace problematic septic systems.
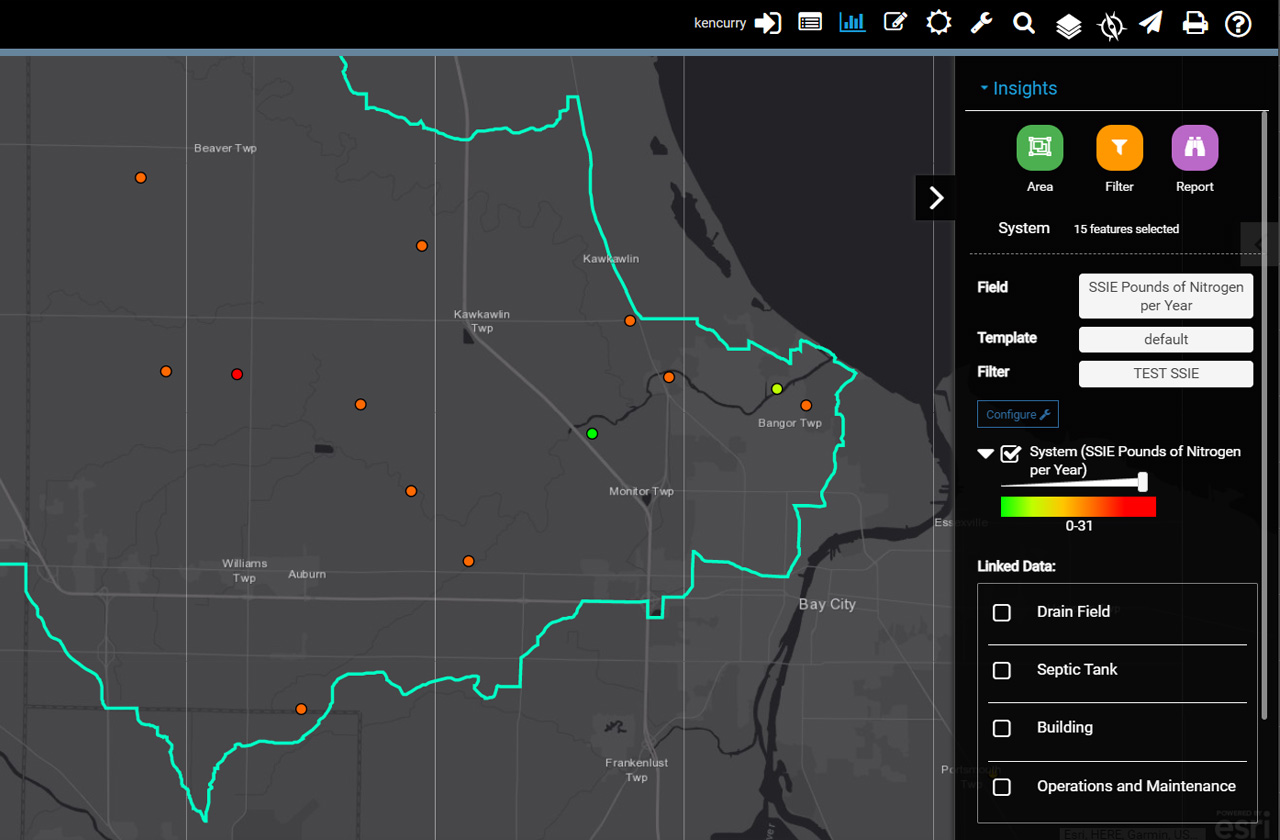
SSIE Nitrogen Removal
The image above displays how much nitrogen is removed by replacing the septic system. Using the first two maps, the ROI of the grant dollars can be viewed for nitrogen by comparing the funding received and the nitrogen removal. This can be communicated more clearly in FetchEH by using a scoring template to combine the funding received and the amount of nitrogen removed, resulting in a clearer picture of the ROI (see next image).
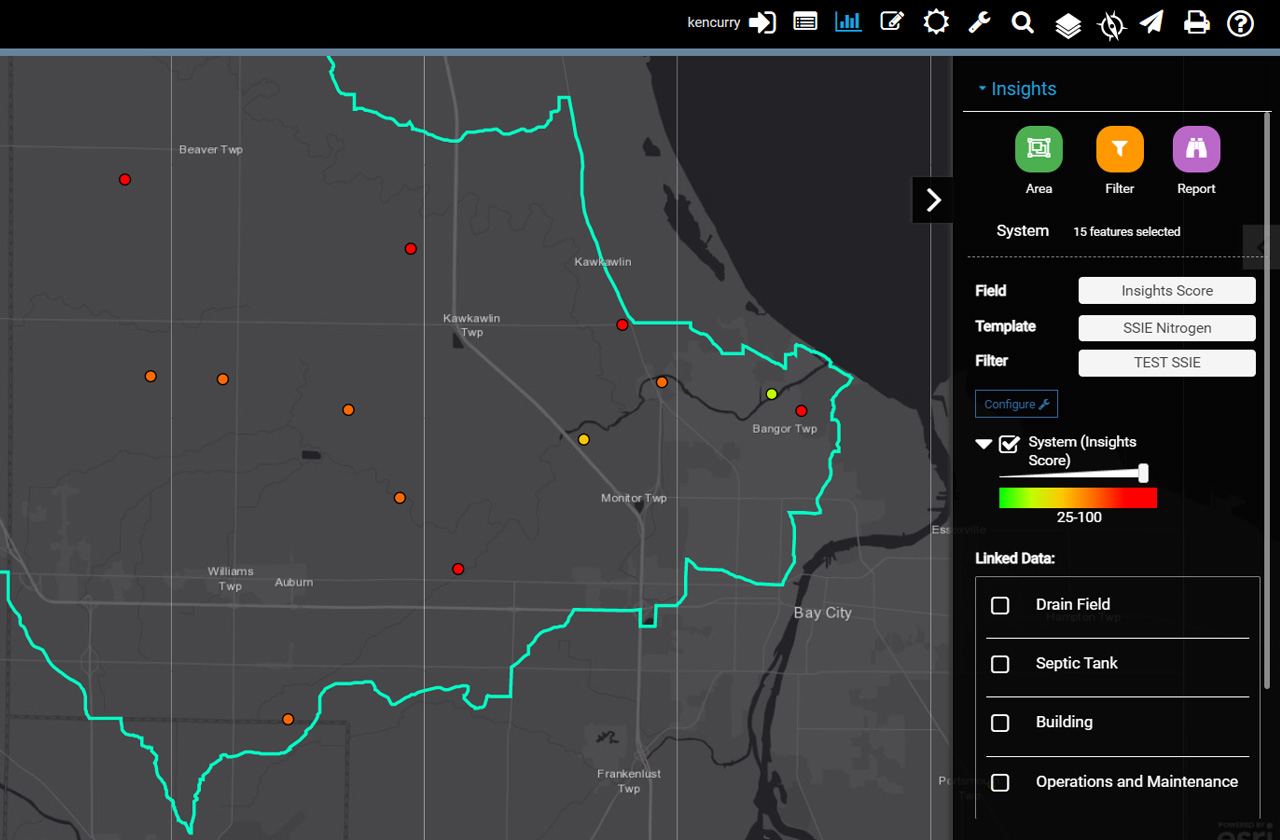
Grant ROI for Nitrogen Removal
The image above displays how effective grant dollars were at removing nitrogen per system replaced. The higher Insights Score (see map legend) corresponds to a higher ROI, or where the least amount of grant funding has the greatest impact in regard to nitrogen removal. This same visualization could be created for each pollutant individually, or all of the pollutants combined to provide a comprehensive look at ROI.
Perhaps as important, is that using this type of analysis allows health departments and grant administrators to target systems that when replaced provide the greatest ROI. This is especially relevant if there are more replacement candidates than available grant funding, which is often the case.
Visualizing benefits in this manner can also be used to demonstrate the results of time of transfer or routine maintenance programs. For these programs, continued support can be challenging so having a tool to clearly communicate the benefits is important.
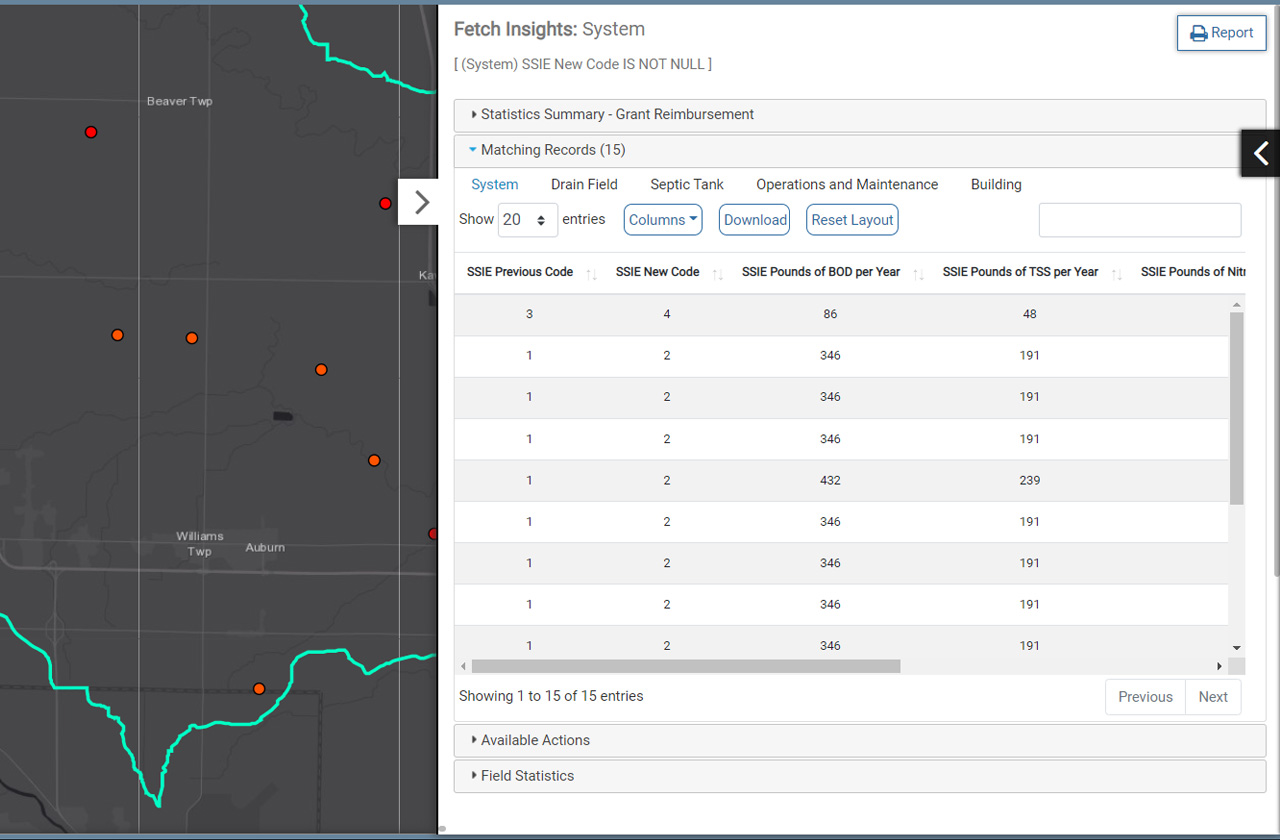
Creating SSIE Reports
The image above illustrates how reporting in FetchEH can be used as another means of understanding SSIE information. In this example the SSIE fields have been selected for the report, which display the previous and new codes for the system type and the pollutants removed as a result of replacing the septic system.
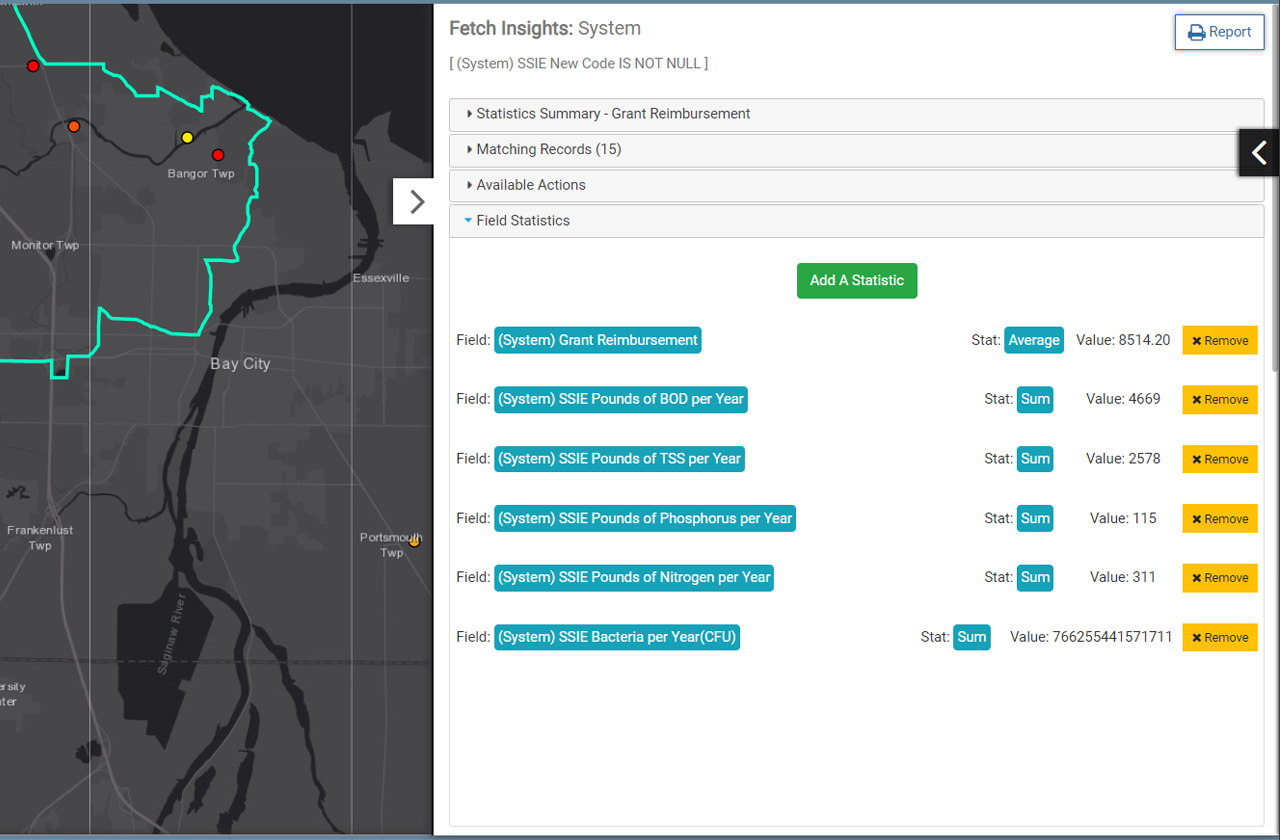
Adding Statistics to Reports
The last image shows an example of adding field statistics to a report, which in this example show total pollutants removed per pollutant type, and the average grant reimbursement to date. Reports like these are often used in combination with map visualizations to better understand information from multiple perspectives.
More to Learn
The SSIE tool provides a standard approach to calculate the ROI of replacing septic systems through grant funding, or programmatic mechanisms like time of transfer and routine maintenance. Integrating the SSIE tool in FetchEH for the Bay County grant project has proved valuable for entering and managing SSIE information with their existing workflows, but equally important is that it also created new opportunities to understand and communicate SSIE information more effectively. These new opportunities help extend the value of SSIE information, to re-purpose it so that it can serve additional workflows, improve decision making and ultimately have the greatest benefit to public health.
We will continue to follow the Bay County grant project to see how the SSIE tool and FetchEH are being used, and to better understand both the benefits and opportunities. If you have any questions or would like to see how the SSIE tool works in Bay County, feel free to get in touch.
More Posts