EH Bellman
Location, data and EH. A better way forward.
EH Bellman - January.20.2020
Representing Onsite Systems on a Map
When we think about location, what does it mean in terms of representing onsite wastewater systems on an interactive map. Onsite wastewater systems are a collection of features connected to a structure or structures, so they include many potential representations on a map. Onsite features can include areas or polygons, like a septic tank or disposal bed, linear features, like an inlet/outlet line or laterals, and points, such as lids, risers, alarms, inspection ports and soil borings.
How the location of an onsite system, and its components, are represented on a map is typically determined by the workflow needs and insights that an organizations wants from the data. This in turn informs how onsite systems are mapped and what information is collected about each component in the system. In this post we will review two approaches to representing the location of an onsite system in FetchEH.
Complete Site Plans
The first approach to representing an onsite system on a map is replicating the site plan as it appears on the final. This means mapping each component, such as the septic tank and disposal area, but also elements like soil borings, septic lines, risers, inspection ports, measurements to each mapped feature and more. The result is that each onsite system component is mapped to scale and is located on the map in its true location on earth. This approach provides the most visual information on the map about an onsite system, but is also the most time consuming to produce.
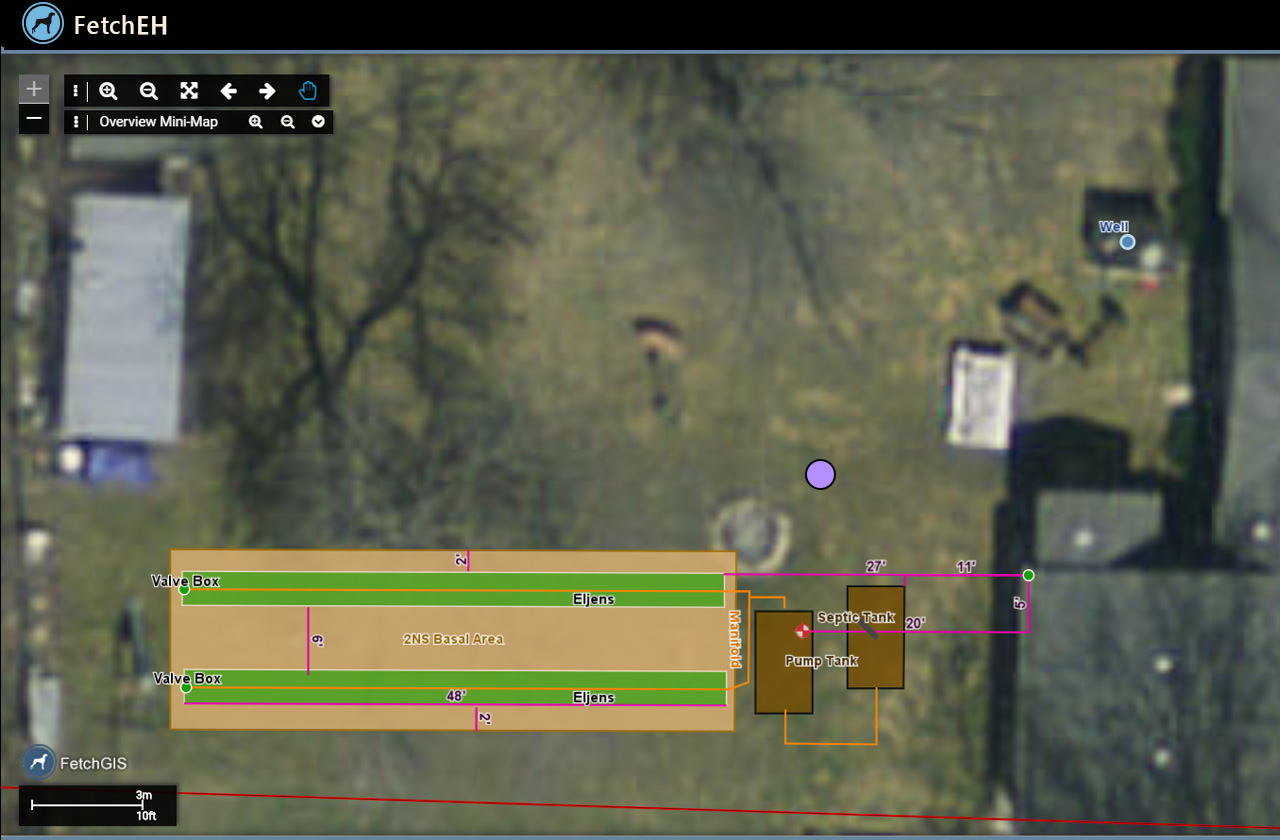
Site Plan Detail
Health departments often use this approach on modern site plans where measurements are available to components, or GPS is used to map components prior to cover. The key is that there is enough location-based information (measurements, GPS, component dimensions, etc.) available to replicate the onsite system on the map. The resulting site plan, now mapped in a digital, to scale format, can be shared with homeowners, contractors, banks, Realtors and other regulators, who when onsite, can literally walk to the components using a GPS enabled smartphone or tablet. The result is that site plans are more accessible, can be shared easily and communicate visual information about a system effectively.
System Point
The problem is that many of the older permits and accompanying site plans do not have any, or provide very limited, measurements that help us accurately map the onsite system. There are also Health Departments that simply do not want to map each system in detail, opting instead to upload a PDF of the final site plan. In these instances, the onsite system is represented using a System Point, which is mapped at the location of the disposal area or other component. This second approach displays the onsite system on the map as a point rather than displaying each of the components on the final site plan.
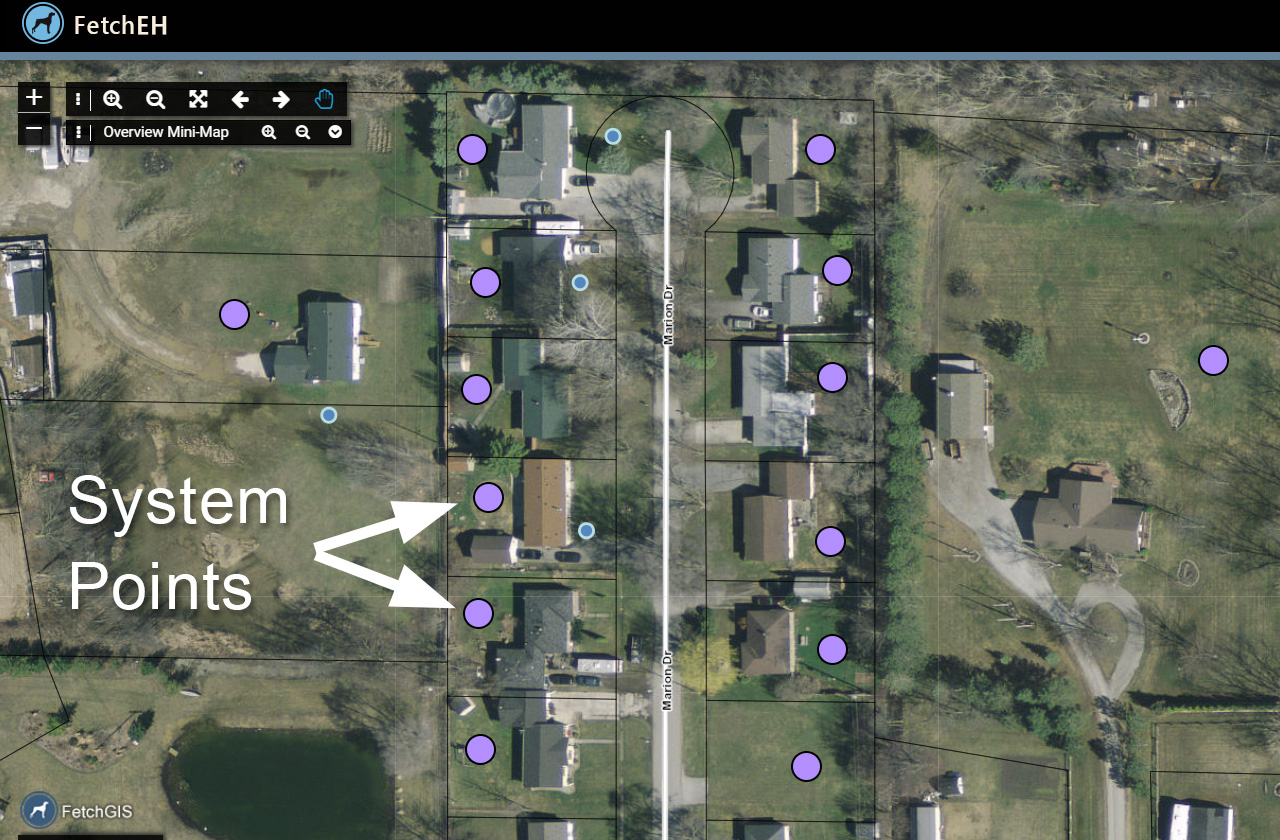
Mapped System Points
As you can see from the first image, even when mapping a site plan in detail, the System Point is used. That is because the System Point in FetchEH is used to store information about each system component, whether the component has been mapped or not. The System Point provides a single feature to use for visualizing insights and other inventory wide workflows like managing operations and maintenance.
In both mapping approaches information about each onsite system component (tank, disposal area, borings, etc.) is entered. This information (tank size, disposal area, mound height, etc.) can then be used with the location of the system to understand more about onsite systems in our communities. From simple questions like visualizing systems by age or type, to more complex questions such as finding trench systems installed between 1970 and 1985 in a specific watershed, it is both the location of the system and the information collected that provides users the ability to gain insights and visually communicate results.
More Posts